

The 123 reversal chart pattern strategy is a three-swing price formation that indicates a potential reversal in trend. It is formed by three price swings or waves with three swing points, which is where the name of the pattern comes from.
Our backtest has the following trading rules (bullish reversal):
- Today’s low must be lower than yesterday’s low
- Yesterday’s low is lower than the low three days ago
- The low two days ago is lower than the low three days ago
- The high two days ago is lower than the high three days ago
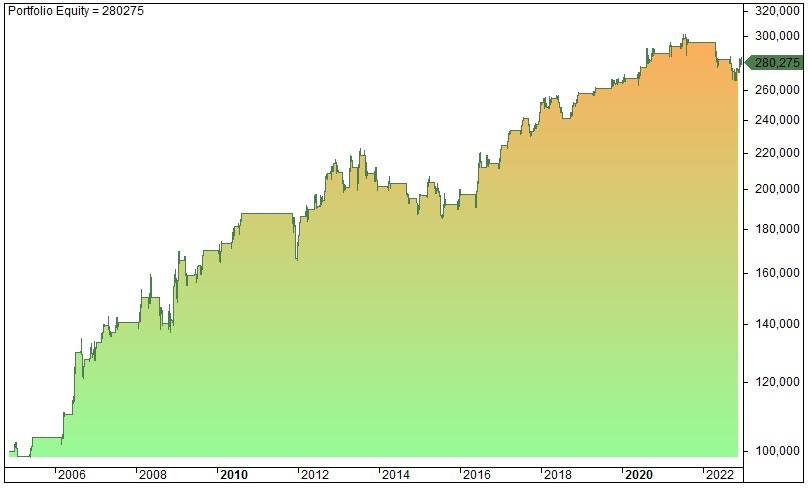
We put in a time exit of N-days and we backtested the strategy on the gold price (the ETF with the ticker code GLD). The equity of exiting after 20 days looks like the image shown below.
We have done 123 bearish reversal backtest also. Check out how it performs here >>
https://www.quantifiedstrategies.com/123-pattern-reversal-strategy/