

The 13/48 trading strategy is a technical analysis method that uses moving averages to identify potential trading opportunities. The strategy is based on the idea that when the 13-period exponential moving average (EMA) crosses above the 48-period EMA, it is a bullish signal that indicates that the price is likely to rise.
In this post, we backtest and find out if the theory is correct.
We backtest the following trading rules:
➨ If the 13-day EMA crosses above the 48-day EMA, we buy; and
➨ We sell when the 48 EMA crosses above the 13 EMA.
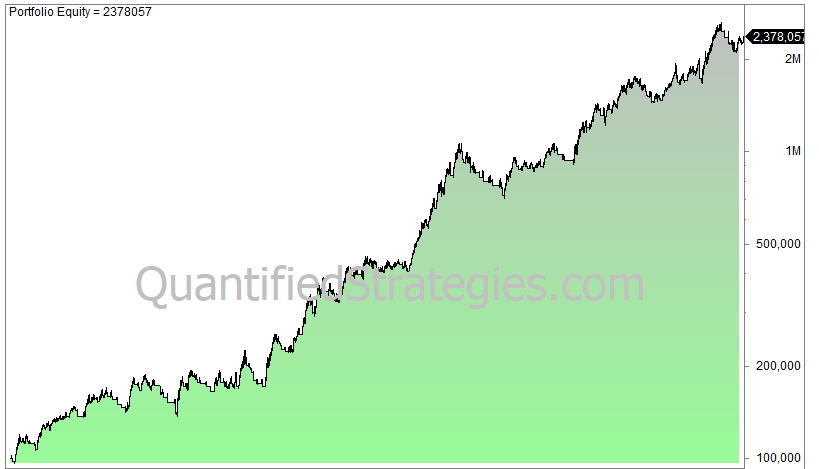
This is a very simple strategy to backtest. We looked at many different markets, and it works best on stocks. Below is the equity curve for the cash index of S&P 500 from 1960 until today.
You are invested 66% of the time and you capture 5.1% annually compared to buy and hold’s 7.2% (not considering reinvested dividends). The risk-adjusted return is slightly better than buy and hold at 7.8%.
You can find more info about this trading strategy here:
https://www.quantifiedstrategies.com/13-48-trading-strategy/