
3 Technical Indicator Strategies That Work

This article looks at 3 technical indicator strategies that work.
Indicators are often dismissed as unreliable or overly simplistic. And in many cases, that criticism is justified. An indicator alone does not create a profitable trading strategy, and almost any setting can be made to look impressive when fitted to historical data.
What matters is whether the indicator can be turned into clear, testable trading rules that have produced consistent results over time.
In this article, we examine three backtested strategies based on three different technical indicators: the Relative Strength Index (RSI), the True Strength Index, and Standard Error Bands.
Each indicator measures the market from a slightly different perspective. RSI helps identify short-term overbought and oversold conditions. The True Strength Index measures momentum while smoothing some of the market noise. Standard Error Bands track price relative to a statistical trend and may help identify unusual deviations or changing market direction.
For each strategy, we define the trading rules and examine the historical results, including returns, drawdowns, win rates, and the number of trades. As always, the conclusions are based on backtesting rather than opinions or carefully selected chart examples.
First, we start with a strategy we call the RSI Drop strategy:
RSI Drop Strategy
Most traders chase strength. This strategy does the opposite: it looks for controlled weakness, waits for RSI to drop into an oversold zone, and then targets the rebound when momentum starts to shift.
RSI Drop Trading Strategy Explained
The RSI Drop Trading Strategy is a mean-reversion approach built around one simple idea:
When a quality market or stock falls too far, too fast, the move often becomes overextended. By using the Relative Strength Index to identify these sharp pullbacks, the strategy aims to enter when fear and selling pressure may be near exhaustion.
Instead of buying randomly after a decline, the RSI Drop Trading Strategy uses clear rules to define when a drop is significant enough to matter, when conditions are favorable for a bounce, and when the trade should be avoided. This makes it a structured way to trade short-term reversals while keeping emotions out of the decision-making process.
We use the RSI because it’s among the top three indicators.
RSI Drop Trading Strategy Backtest
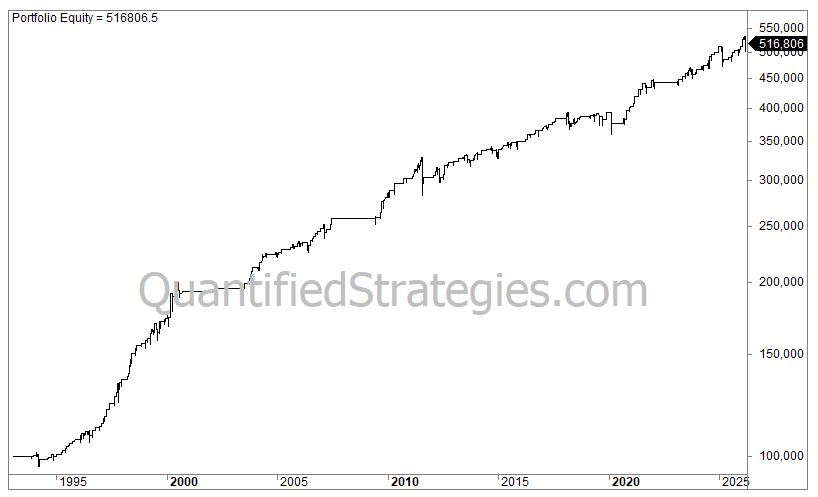
We backtested it (trading rules at the bottom of the article) on the S&P 500:
Performance
No. of trades: 244
Average gain per trade: 0.7%
Win ratio: 81%
Profit factor: 36
Annual returns (CAGR): 5.1%
Exposure/time in the market: 12%
Risk-adjusted return: 42% (CAGR divided by time spent in the market (0.12))
Max drawdown: 14% (buy and hold 55%)
Let’s go to the second technical indicator:
True Strength Index Strategy
The True Strength Index, or TSI, is a momentum oscillator developed by William Blau. It is designed to show both the direction and strength of price momentum, while smoothing out some of the noise that often appears in raw momentum indicators.
The indicator moves above and below a zero line. When the TSI is above zero, momentum is generally positive. When it is below zero, momentum is generally negative. Traders also use it to identify signal-line crossovers, divergences, and possible overbought or oversold conditions.
What Is The True Strength Index?
The True Strength Index is a double-smoothed momentum indicator. It measures price change, smooths that change with exponential moving averages, and then compares it with the double-smoothed absolute price change.
In plain English, the TSI tries to answer this question:
Is the market moving with enough strength to suggest persistent momentum, or is the move weak and likely to reverse?
True Strength Index Formula
The formula is:
TSI = 100 × double-smoothed price change / double-smoothed absolute price change
A common calculation uses:
Price change = current close minus previous close
A 25-period EMA of price change
A 13-period EMA of that first EMA
The same two-step EMA smoothing on the absolute price change
Divide the double-smoothed price change by the double-smoothed absolute price change
Multiply by 100
Many charting platforms also add a signal line, often an EMA of the TSI itself.
True Strength Index vs RSI
The RSI and TSI are both momentum oscillators, but they are calculated differently.
RSI compares average gains with average losses over a lookback period. TSI measures price change, double-smooths it, and normalizes it by double-smoothed absolute price change.
In practice, RSI is often used for overbought and oversold analysis, while TSI is often used for momentum direction, signal-line crossovers, and trend confirmation.
True Strength Index (TSI) Trading Strategy
We backtested the strategy on the gold price:
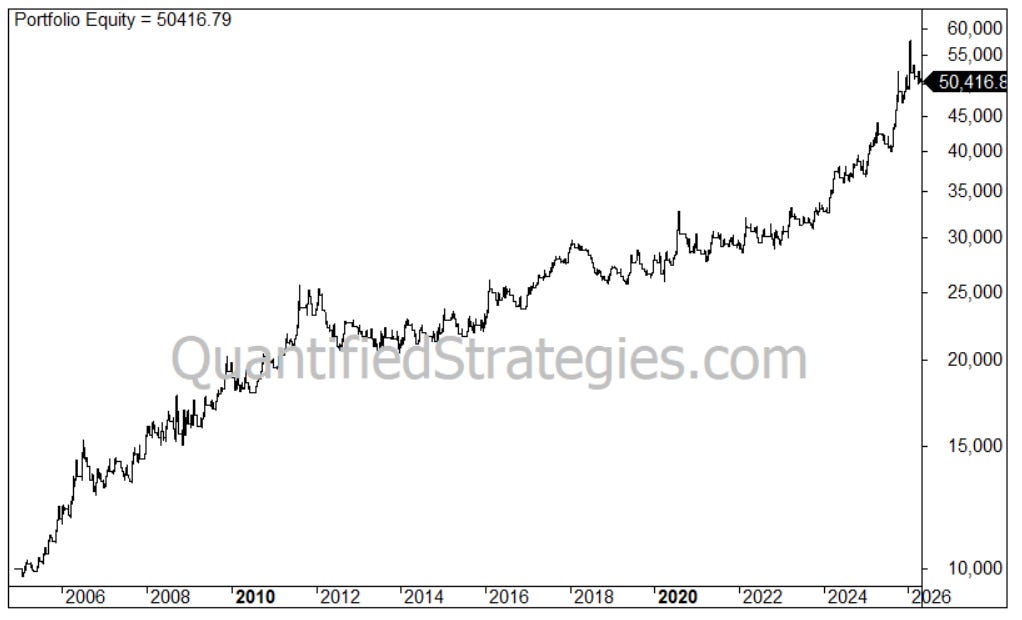
Strategy Type: Momentum/trend-following
Market: Gold (GLD)
Performance
No. of trades: 232
Average gain per trade: 0.77%
Win ratio: 40%
Profit factor: 1.7
Annual returns (CAGR): 7.8%
Exposure/time in the market: 50%
Risk-adjusted return: 15% (CAGR divided by time spent in the market (0.5))
Max drawdown: 20%
Worth noting is the low win ratio. It’s still profitable because the average winner is 4.5%, while the average loser is only 1.6%.
We end this article by looking at the last of the 3 technical indicator strategies that work:
Standard Error Bands Strategy
Standard Error Bands are a technical analysis indicator designed to show both market direction and volatility around a trend.
At first glance, they look similar to Bollinger Bands or other envelope-style indicators, but their calculation is different. Instead of drawing bands around a moving average, Standard Error Bands are built around a linear regression line.
What Are Standard Error Bands?
Standard Error Bands consist of three main components:
A linear regression line
An upper band
A lower band
The middle line represents the estimated trend over a chosen lookback period. The upper and lower bands are then plotted a certain number of standard errors above and below that regression line.
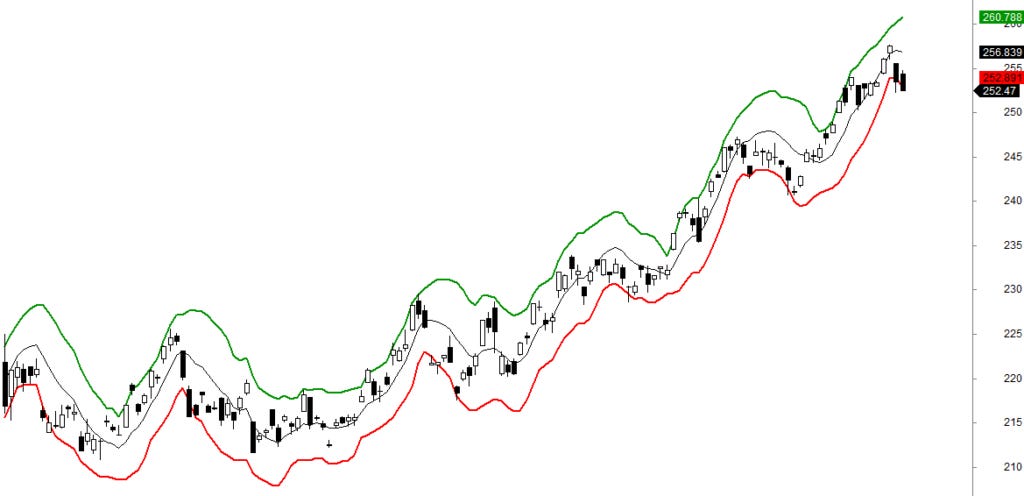
In simple terms, Standard Error Bands measure how closely the price follows the current trend. If prices stay close to the regression line, the standard error is low and the bands contract. If prices move erratically around the regression line, the standard error increases and the bands widen.
Standard Error Bands Formula
The general calculation is:
Upper Band = Linear Regression Line + N × Standard Error
Lower Band = Linear Regression Line − N × Standard Error
A common setting is two standard errors above and below the regression line, although traders can adjust both the lookback period and the multiplier.
For example, many traders use a 21-period setting with a multiplier of 2. This means the indicator estimates the current trend over 21 bars and plots the bands two standard errors above and below that trend.
Standard Error Bands Trading Strategy Backtest
We backtest a strategy (see trading rules at the bottom) on all S&P 500 stocks from 1990 to today (no survivorship bias).
We backtested only stocks that closed above $ 10 and had an average trading volume of at least 5 million shares.
This is the equity curve, including 0.03% commissions for each trade (0.06% for a round trip):
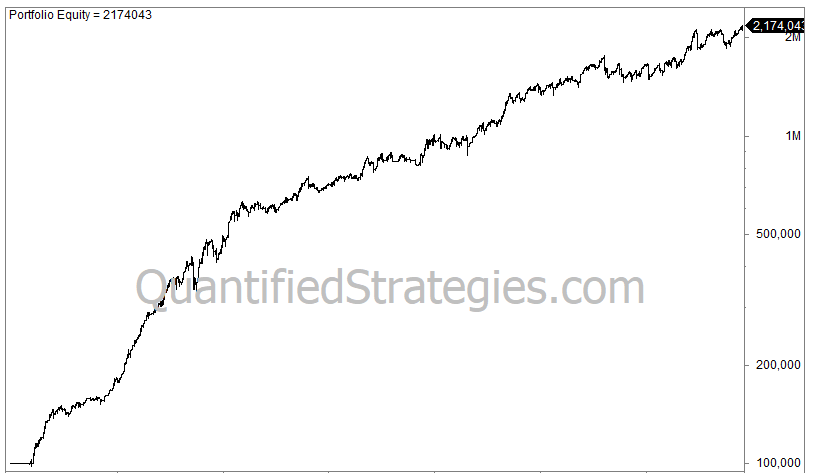
Strategy type: Mean reversion
Market: S&P 500 stocks (individual stocks)
We allocated 20% of the equity to each position. Thus, we can hold 5 positions.
Performance
No. of trades: 2438
Average gain per trade: 0.7%
Win ratio: 64%
Profit factor: NA
Annual returns (CAGR): 9.3%
Exposure/time in the market: 33%
Risk-adjusted return: 28% (CAGR divided by time spent in the market (0.33))
Max drawdown: 22%
Trading Rules
These are the trading rules for all 3 strategies: