9 More Free Trading Strategies
Did you know that we also have a Twitter account where we publish unique trading strategies and ideas?
To not miss out on any of them then give us a follow.
Below you can find examples of some of our strategies and ideas not published anywhere else:

Tomorrow, Friday, is the monthly jobs report.
The upper chart is returns from the open to the close (avg 0.07%) (job report day).
The lower chart is from Thursday's close until the close of Friday (the day of the report). 0.13% avg.
$SPY $SPX


December is a good month for #stocks: average gain is 1.4% and a 75% chance of going up.
(Probably helped by rising bonds?)
$SPX invested only in December:


Below is the equity curve of being invested in $SPX before and after each holiday.
3.5% CAGR, exposure 19%. Max drawdown 24%.
Two of the holidays are consistently poor, though.


One of the best periods of the year for #stocks is from today until the next year.
Below is the equity curve when invested in $spx from the week before Thanksgiving until the close of the year:
The average is 2.1%.


We are entering the strongest seasonality for #stocks: the first three trading days of the month.
We have mentioned this multiple times (low-hanging fruit).
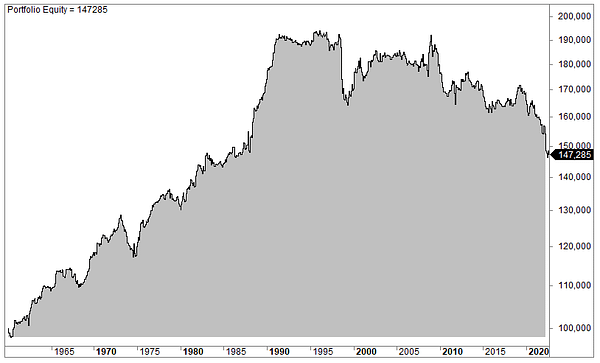
Below is the equity curve of being invested in $spx only during the first three trading days of the month (since 1960):


