A Simple Trend Following System and Strategy In The S&P 500 (By Meb Faber And Paul Tudor Jones)
Go long the S&P 500 when the price crosses the 200-day moving average, and sell when it crosses below the 200-day average. This is probably not the most sensational strategy, to say the least. However, Faber’s article is a great read because of his “simple” ideas, yet very powerful.
We backtest the following trading rules:
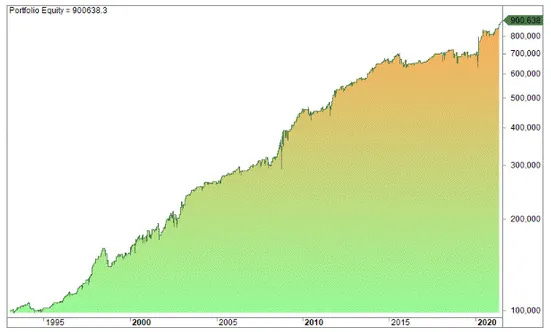
We buy when the close is above the 200-day moving average, and sell when it crosses below. The logarithmic equity curve above has a max drawdown of 28%, reached in 2002, and the CAGR is 6.73% while buy & hold is 7.16% (the test is not adjusted for dividends).
S&P 500 trends little in the short term, but in the long term, it trends upward.
Result:
We go long when the close crosses its ten-month moving average and sells when the close is below the ten-month average. The equity curve we found is shown below.
100 000 invested in 1960 is worth 5 million today, compounded but not including dividends. The biggest drawdown happened during the crash in October 1987 with 26%. The strategy has a CAGR of 6.56% which is slightly lower than the buy & hold at 7.16%.
You can find more info about this trading strategy here:
https://www.quantifiedstrategies.com/a-simple-trend-following-system-on-the-sp-500/
#SP500 #CAGR #LongTermInvesting #tradingstrategy #systematictrading #investing #trading #tradingtips #algotrading


