
Bollinger Band Breakout Strategy

The Bollinger Bands breakout strategy aims to capitalize on price movements that occur when the bands are breached.
It is commonly used to identify potential trading opportunities, as breaks above or below the bands often signal shifts in market volatility. The standard Bollinger Bands settings consist of a 20-day moving average with bands set two standard deviations away. However, only a backtest can tell the best parameter settings.
A move above the upper band is typically interpreted as a bullish signal, encouraging traders to consider long positions. On the other hand, a move below the lower band is viewed as bearish, suggesting potential short positions.
We backtested a Bollinger Bands breakout strategy on the S&P 500 from 1960 to the present, resulting in the following equity curve:
Bollinger Band Breakout Strategy Backtest
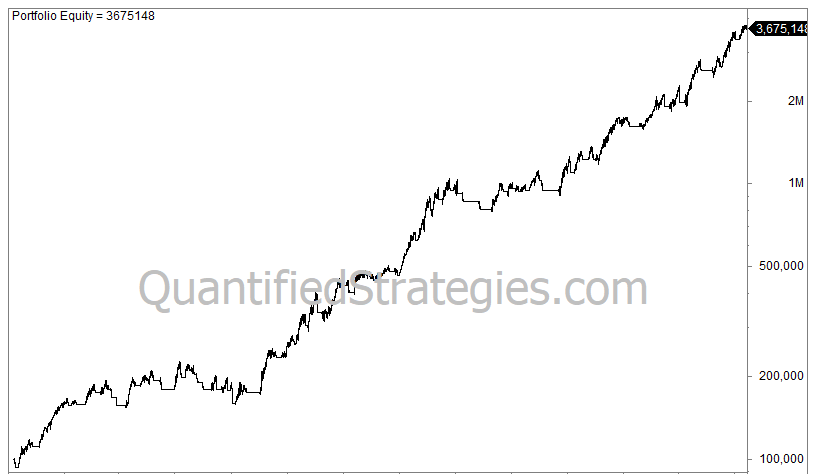
We use a long lookback period and buy when the close ends above the upper band and sell when it crosses below the lower band. There are 58 trades, and the CAGR is 5.7% excluding dividends. However, you are invested only 64% of the time, and the max drawdown is 30%.
Trading Rules
