
Breakout VIX Strategy

Today, we present a breakout VIX strategy.
Most traders look at the VIX as a fear gauge. When it spikes, headlines turn dramatic, portfolios turn red, and investors start searching for protection. But the VIX can also be viewed another way: as a tradable signal.
In this article, I’ll look at a simple Breakout VIX strategy: a rules-based approach that attempts to capture sharp changes in market volatility.
The idea is straightforward. Instead of predicting whether volatility will rise or fall, we wait for the VIX to break out of its recent range and then use that move as a signal.
Volatility tends to cluster. Quiet markets can stay quiet for a long time, but when fear suddenly enters the market, the change is often fast and persistent enough to create trading opportunities. A breakout strategy tries to exploit exactly that behavior.
Let’s test it.
Breakout VIX Strategy
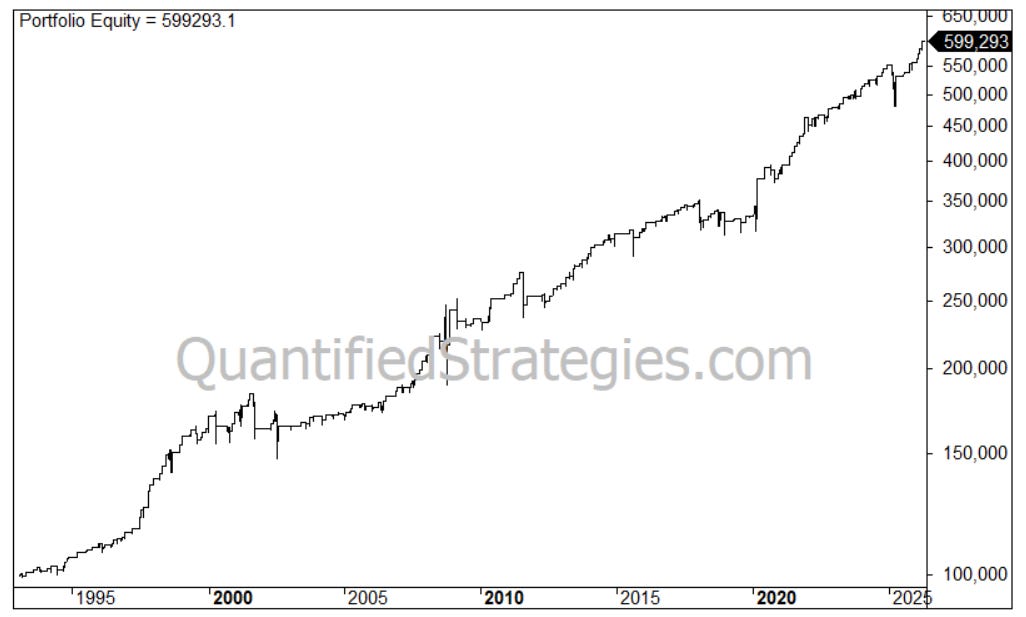
We quantified some trading rules (see rules at the bottom), and we got the following equity curve:
Strategy type: Volatility strategy.
Market: US stocks (SPY).
Performance
No. of trades: 252
Average gain per trade: 0.75%
Win ratio: 77%
Profit factor: 2.5
Annual returns (CAGR): 5.5%
Exposure/time in the market: 10%
Risk-adjusted return: 52% (CAGR divided by time spent in the market (0.1))
Max drawdown: 23%
Trading Rules
We backtested the following trading rules: