
Commodity Channel Indicator (CCI) Strategy

Today, we look at a Commodity Channel Indicator (CCI) Strategy.
The Commodity Channel Index, better known as CCI, is a momentum oscillator that compares today’s price with its average price over a chosen period.
CCI Is An Oscillator
In simple terms, the CCI tells you whether price is trading far above or far below its recent average. A high reading suggests strength or possible overbought conditions, while a low reading suggests weakness or possible oversold conditions. Traditionally, readings above +100 are considered overbought, and readings below -100 are considered oversold.
 price action in the top panel and the CCI (Commodity Channel Index) oscillator in the bottom panel, with the indicator line fluctuating between +200 and -200 levels.")
The Best Assets To Trade Using CCI
Despite the name, CCI is not only for commodities. It can be used on stocks, ETFs, bonds, and other markets. However, based on backtesting, it tends to work best on assets with mean-reverting behavior, especially stocks and, to a lesser extent, bonds.
How To Use The CCI Indicator
The most useful way to apply CCI is not necessarily as a trend-following tool, but as an oversold indicator.
For example, short lookback periods such as 5 to 9 days may work better on daily stock data because they capture short-term pullbacks.
Commodity Channel Indicator (CCI) Strategy - Backtest
Let’s backtest a Commodity Channel Indicator (CCI) strategy. We backtest the S&P 500 (SPY):
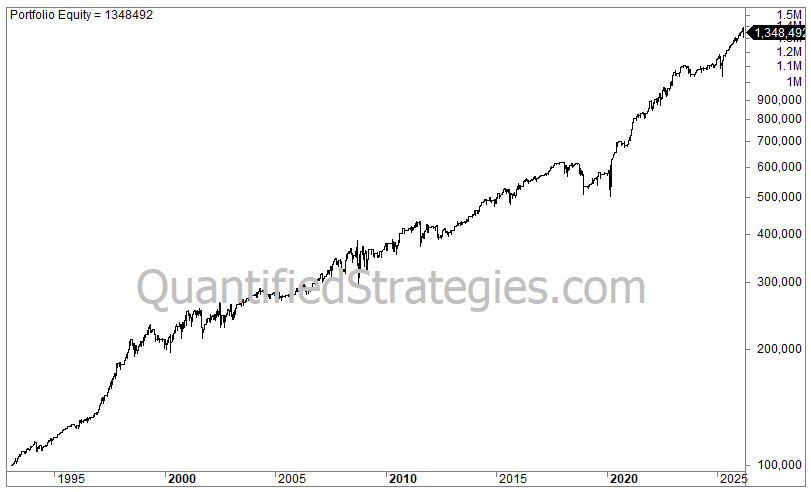
Performance
No. of trades: 643
Average gain per trade: 0.45%
Win ratio: 73%
Profit factor: 1.9
Annual returns (CAGR): 8.1%
Exposure/time in the market: 28%
Risk-adjusted return: 28% (CAGR divided by time spent in the market (0.28))
Max drawdown: -23%
Trading Rules
We made the following trading rules:
