
Doji Candlestick Strategy: Does It Really Predict Reversals?

Doji Candlestick Strategy: Does It Really Predict Reversals? The Doji is one of the most recognizable candlestick patterns in technical analysis, often interpreted as a sign of indecision and a possible market turning point.

But a pattern that looks convincing on a chart does not necessarily offer a profitable trading edge. In this article, we explain how the Doji candlestick is formed, what traders believe it signals, and what happens when we test it using historical market data.
All 75 Candlesticks Defined And Coded
Before we do the backtest, we remind you that we have defined and coded all 75 candlestick patterns. We backtested the candlestick patterns, and they do work.
Doji Candlestick Strategy: Does It Really Predict Reversals?
We backtested the doji on the S&P 500 (SPY), and we got the following result:
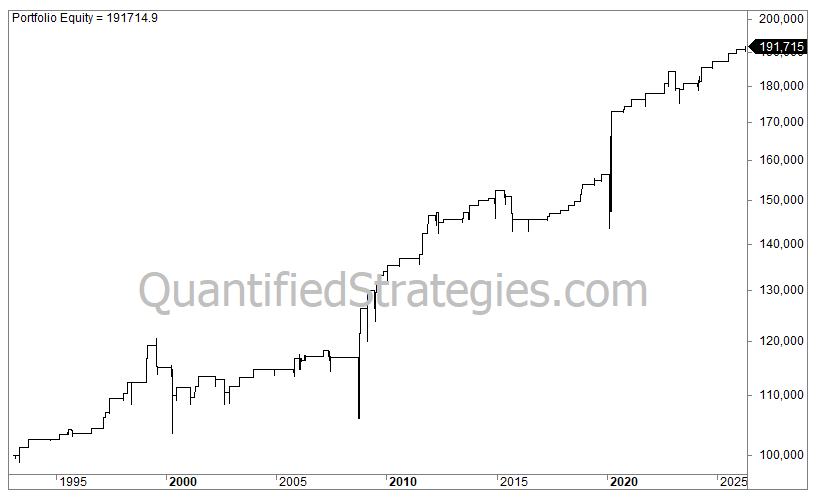
Performance
No. of trades: 96
Average gain per trade: 0.7%
Win ratio: 73%
Profit factor: 2.9
Annual returns (CAGR): 2%
Exposure/time in the market: 4%
Risk-adjusted return: 40% (CAGR divided by time spent in the market (0.04))
Max drawdown: -13%
Trading Rules
We made the following trading rules: