


Donchian Channels Trading Strategy – Trading Guide and Effectiveness (Backtest Commodities And S&P 500)

The Donchian Channels (or bands) are formed by two bands: an upper band based on the high of the last N bars, and one lower band based on the low of the last N bars. Donchian Channels work well as a trend following indicator for commodities and currencies, but not for stocks. However, we turned the Donchian Channels upside down and made the Donchian Channels work as a mean reversion indicator for stocks.
Let’s test a simple Donchian Channel strategy on the S&P 500. We test the following strategy:
We buy when the close breaks above the 20-day high.
We sell/exit when the close ends below the 20-day low.
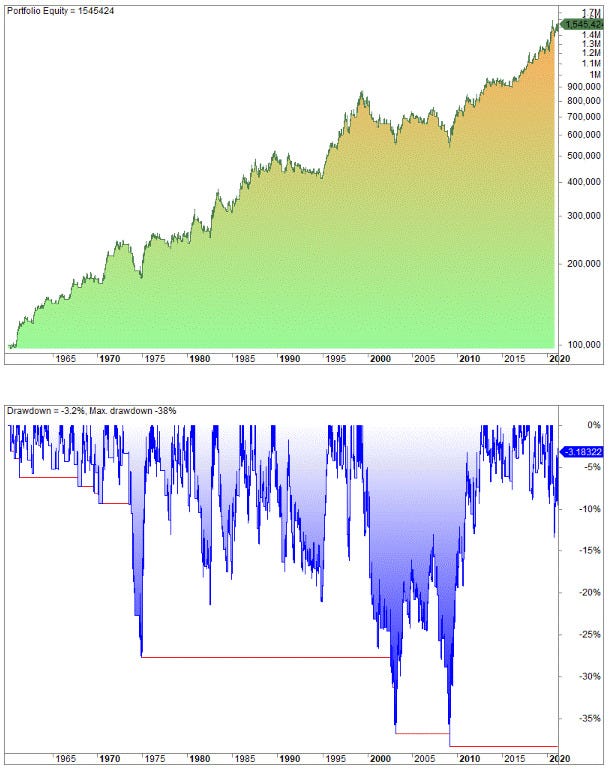
This strategy has produced this equity curve (Shown below) from 1960 to October 2021 (only the long side and not including reinvested dividends)
We optimize the test and we get the best results around 40 days for the upper band and a shorter lookback period for the lower band. Check out here >>
https://www.quantifiedstrategies.com/donchian-channel/