
ISM Manufacturing Index PMI: Backtest Insights

The ISM Manufacturing Index, or PMI is an important indicator of the health of the US manufacturing sector. The index is based on a survey of manufacturing purchasing managers and measures factors such as production, new orders, employment, and supplier deliveries. A reading above 50 indicates that the manufacturing sector is expanding, while a reading below 50 indicates that it is contracting.
We backtest the following trading rules:
➨ When the readings are above 50, we buy the open of the month (S&P 500),
➨ We sell at the open the next month (thus holding for one month)
The equity curve looks like the image shown below.
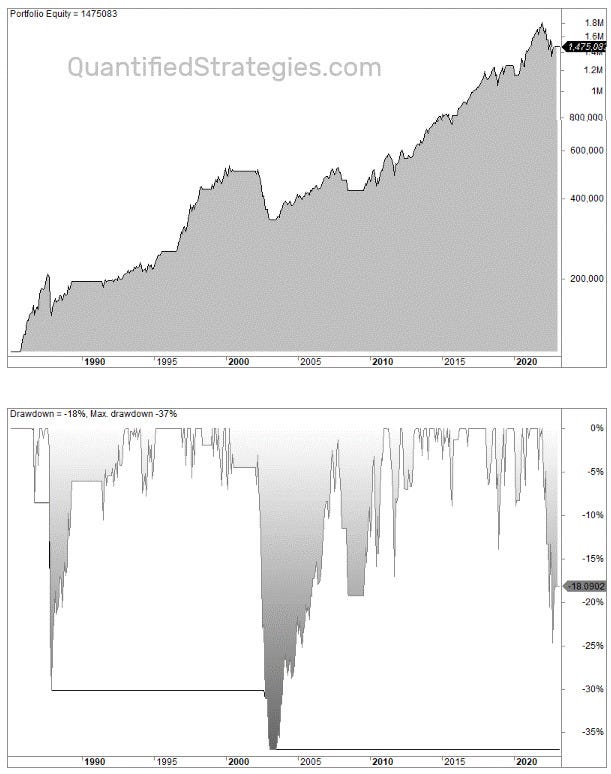
The strategy is invested 72% of the time, and the annual return is 7.3% (compared to 8.5% for S&P 500). Thus, most of the gains have come when readings are above 50, but it has also reduced drawdowns.
This also means that low readings below 50 have proven mediocre – even adjusted for time spent in the market.
We also have another backtest with different asset (Gold). Let's look how it performs:
https://www.quantifiedstrategies.com/ism-manufacturing-index-pmi/