
MACD and RSI Trading Strategy (Rules, Backtest — 80% Win Rate)

The MACD and RSI strategy refers to a trading method that makes use of both indicators in analyzing and trading the markets. The combination of both momentum indicators may give more insight into what the market may do next and how it could move in the future.
We set up a specific MACD and RSI strategy with trading rules so we can backtest it.
We incorporate both the MACD and RSI indicators, and we also use a third indicator as a mean reversion filter. When all three conditions are met, we buy, and we sell when the mean reversion filter reverses (i.e. opposite from the buy criterium). This is it. It’s not very complicated, but it works well.
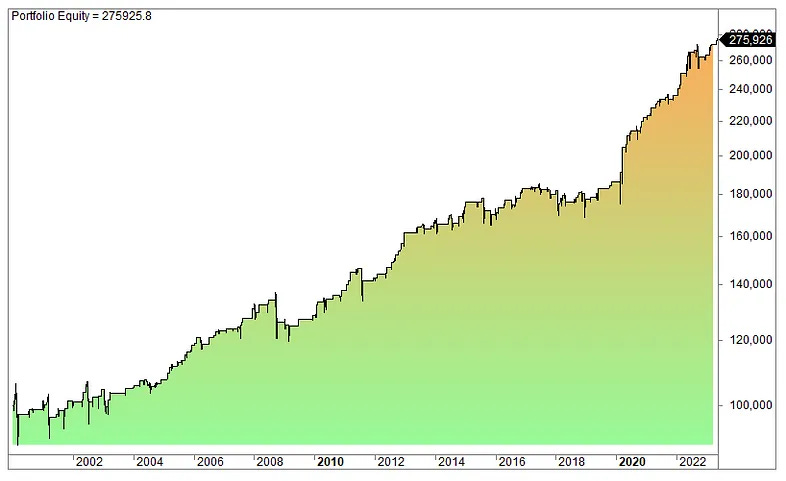
The strategy works best on stocks in a specific sector. This is what the strategy’s equity curve (shown below) looks like on an ETF.
There are 169 trades, and the average gain per trade is 0.62%. Most years show positive returns, while the negative ones show small losses. The worst year was 2008, with a modest 3.6% loss (compared to 55% for S&P 500).
You can find more info about this trading strategy here:
https://www.quantifiedstrategies.com/macd-and-rsi-strategy/