
MACD Histogram Trading Strategy — (Rules, Setup, Backtest, Example Insights)

The MACD-histogram trading strategy is a popular mean-reversion system that helps identify momentum changes and potential reversal points in the market. This strategy has generated 6669 trades on a portfolio of 77 ETFs, with long positions performing better than short positions. The entry point is on the close, and the exit point is when the close is higher than the previous day. The average gain per trade since 2000 has been positive for the majority of the ETFs, indicating the effectiveness of the MACD-histogram strategy.
We backtest the following trading rules:
The MACD Histogram bar must have fallen 4 days in a row.
The fourth latest bar must have been below zero.
The current close of the ETF must be lower than the day before.
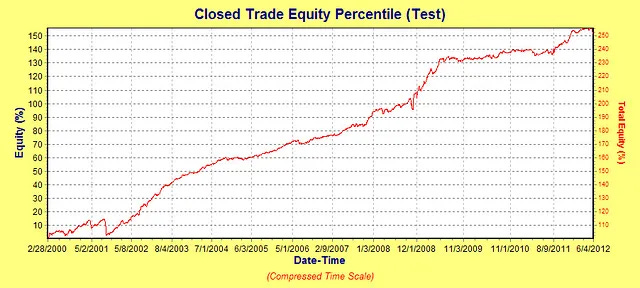
It is a pretty good result. Assuming one can only trade a maximum of ten positions at a time as a portfolio, we get this equity curve (Shown in the image)
You can find more info about this trading strategy here:
https://www.quantifiedstrategies.com/macd-histogram/