
MACD Histogram Trading Strategy: Rules, Setup, Backtest, and Example Insights

This post looks at the MACD histogram. We’re trading some strategies based on mean reversion on a sample of 77 ETFs. Those ETFs are the most liquid ones. One of the strategies we trade is based on the MACD-Histogram.
It’s a popular indicator and we have tweaked a little bit. On a per-trade basis, this is one of the best strategies.
We backtest the following trading rules:
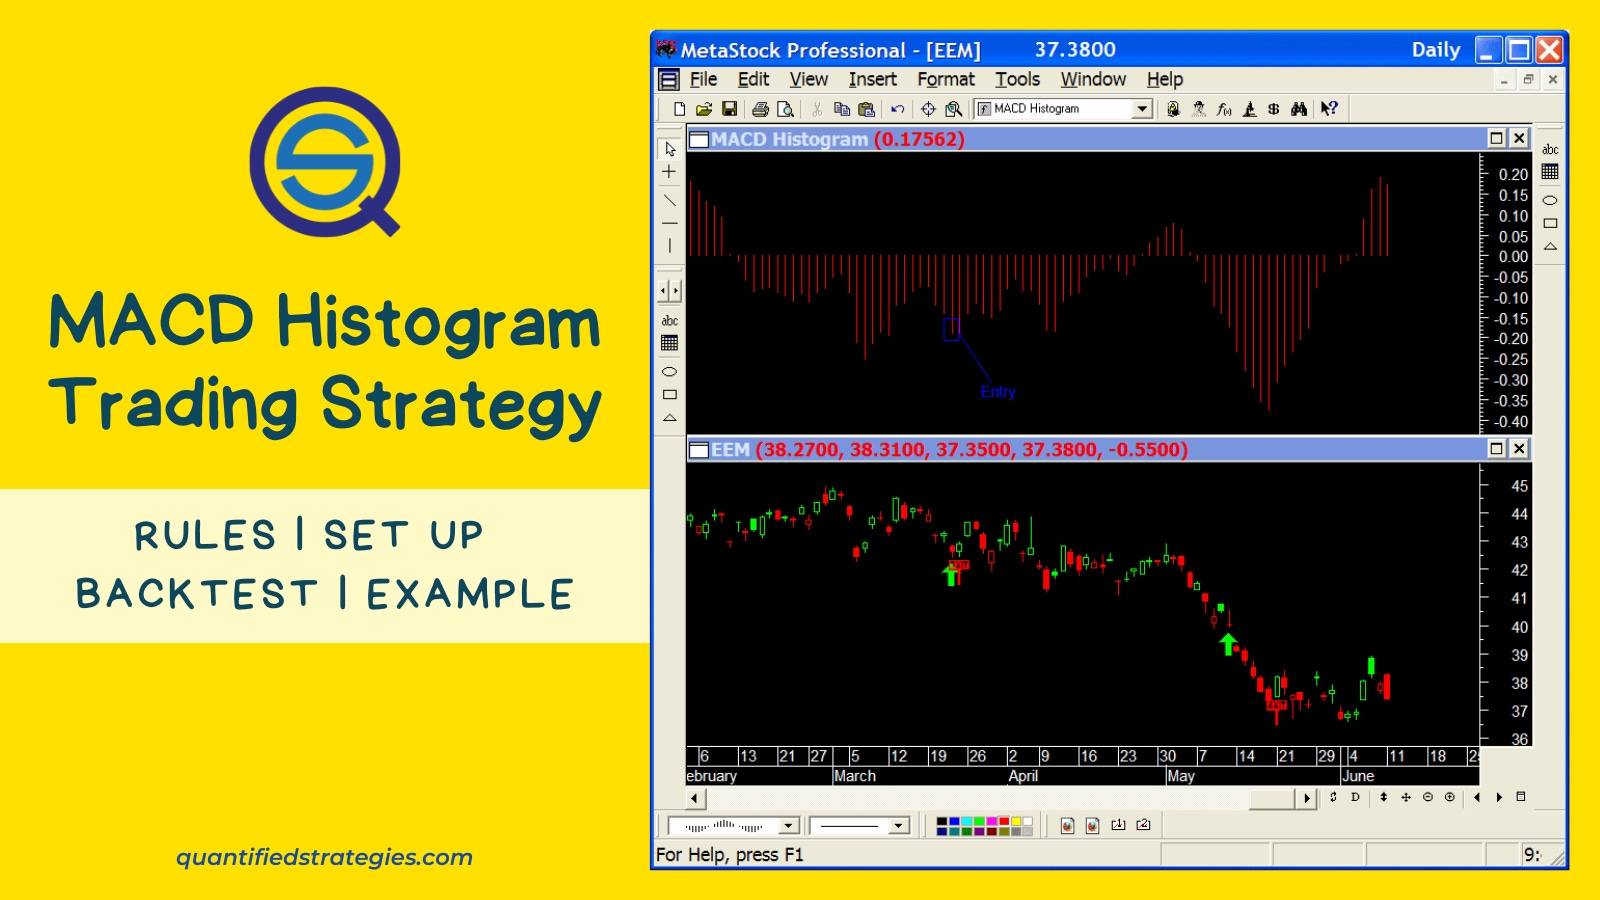
The MACD Histogram bar must have fallen 4 days in a row.
The fourth latest bar must have been below zero.
The current close of the ETF must be lower than the day before.
Entry is on the close. The exit is on the first day when the close is higher than the day before. Below is an example (exit was on the close the day after because the ETF rose in price)
Want to learn more about it? Check MACD Histogram Trading Strategy
#tradingstrategies #MACD #Histogram #TradingStrategy #Backtesting #ETFs #MeanReversion #TechnicalAnalysis #Investing #FinancialMarkets