


NAAIM Exposure Index Trading Strategy – Backtest

Compiled by the National Association of Active Investment Managers (NAAIM), the NAAIM Exposure Index represents the average exposure to US Equity markets reported by its members. The indicator line is a two-week moving average of the NAAIM managers’ responses. Our backtests indicate there are better indicators for contrarian trading strategies.
In our backtest we make the following rules in plain English (actually it’s two backtests):
* Make a 10-week moving average of the NAAIM index.
* If the last weekly NAAIM reading is below the 10-week average, stay long S&P 500 the following week. Sell when reading ends up above its average.
* If the last weekly NAAIM reading is above the 10-week average, stay long S&P 500 the following week. Sell when reading ends up below its average.
If we invest 10 000 in July 2006 and reinvest the proceeds up until today, we get the two equity curves shown in the image below.
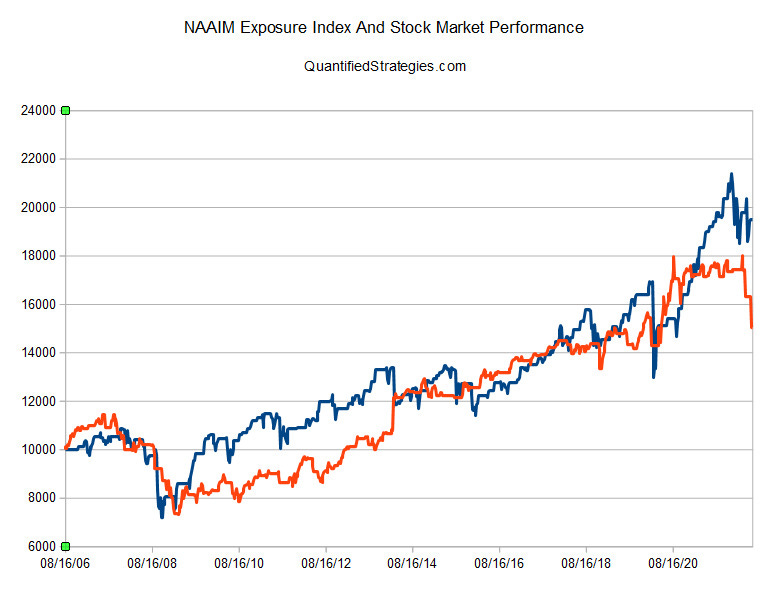
The blue line in the chart above is being invested when the weekly reading of the NAAIM is below its 10-week moving average. As you can see, the returns are better when readings are low compared to “high” (above its average). The CAGR is 4.4% and 2.5% excluding dividends.
We also explained what are the NAAIM Exposure Index responses and how it is used to estimate investors’ sentiment in the U.S. stock market here >>>
https://www.quantifiedstrategies.com/naaim-strategy/