

Compiled by the National Association of Active Investment Managers (NAAIM), the NAAIM Exposure Index represents the average exposure to US Equity markets reported by its members. The indicator line is a two-week moving average of the NAAIM managers’ responses. Our backtests indicate there are better indicators for contrarian trading strategies.
We backtest the following trading rules:
Make a 10-week moving average of the NAAIM index.
If the last weekly NAAIM reading is below the 10-week average, stay long S&P 500 the following week. Sell when reading ends up above its average.
If the last weekly NAAIM reading is above the 10-week average, stay long S&P 500 the following week. Sell when reading ends up below its average.
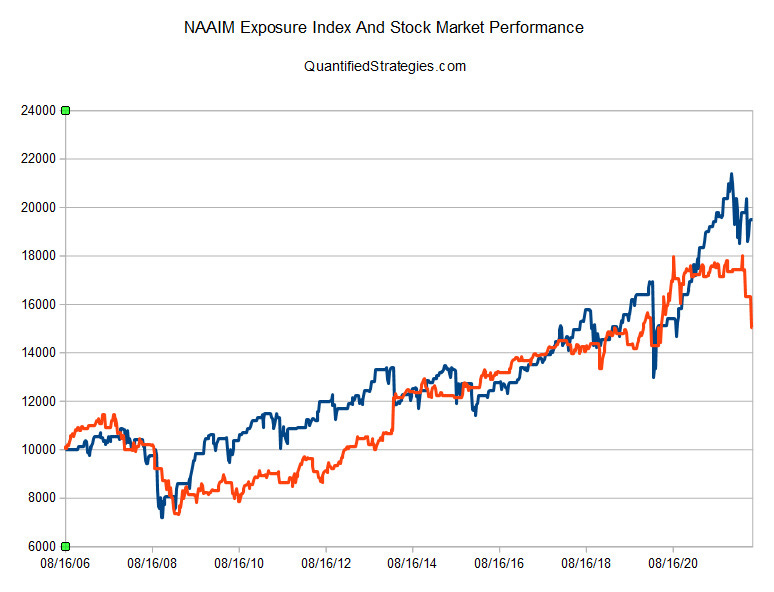
If we invest 10 000 in July 2006 and reinvest the proceeds up until today, we get the two equity curves (Shown below)
You can find more info about this trading strategy here:
https://www.quantifiedstrategies.com/naaim-strategy/