
NR7 Trading Strategy Explained For Beginners

This post is about the NR7 trading strategy explained for beginners.
The NR7 concept takes the opposite approach — it asks you to pay attention when markets become quiet.
The NR7 pattern was introduced by Tony Crabel in 1990 and is based on a straightforward observation: significant price moves are often preceded by periods of unusually low volatility.
An NR7 day simply means that the day’s trading range — the difference between the high and the low — is the narrowest seen during the last seven trading sessions.
There are no indicators involved. No complex calculations. Only price itself.
An important detail is often overlooked: NR7 was originally created to anticipate volatility expansion, not to serve as a standalone trading signal.
Why might this idea work?
Financial markets rarely move randomly between calm and chaos. Instead, they tend to alternate between phases of expansion and contraction. When price ranges compress, market activity slows and tension builds. These quiet periods frequently come before stronger directional moves.
In other words, shrinking volatility can signal that a larger move is approaching.
Trading Rules
Volatility is measured as the daily High minus Low.
When today’s range is the smallest compared with the previous six trading days, a long position is opened at the close.
The position is closed at the close once price finishes above the previous day’s high.
The strategy does not try to forecast market direction.
Unlike many short-term systems that rely on buying sharp pullbacks, this approach enters during calm conditions. Because of that, it often performs well alongside mean-reversion strategies, adding diversification rather than duplicating the same type of exposure.
This diversification benefit is frequently underestimated. Many traders unknowingly stack strategies that depend on identical market behavior. NR7 introduces a different dynamic.
Backtesting highlights several characteristics:
Solid long-term results
Limited time spent in the market
A large number of small, consistent gains instead of occasional outsized profits
At the same time, there are clear limitations:
The average trade size is modest
Performance depends heavily on exits and additional filters
This is the equity curve for SPY since inception:
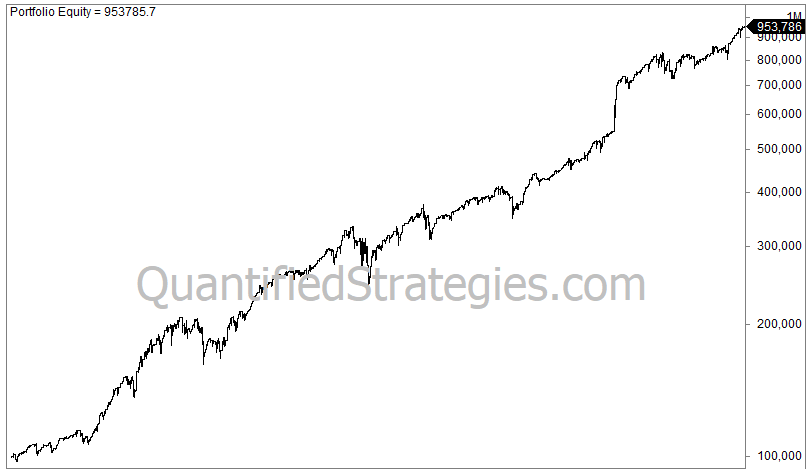
There are many trades: 924, but the average gain is modest at 0.25%.
This suggests that NR7 should be viewed as a building block rather than a complete system.
Trading edges do not always emerge from increasing complexity. Sometimes they come from recognizing simple recurring patterns in market behavior.