
RSI Pullback Strategy

The RSI pullback strategy is a simple way to look for short-term buying opportunities during an existing uptrend.
Instead of buying after prices have already moved higher, the strategy waits for a temporary decline. The Relative Strength Index, or RSI, is then used to identify when the market may have become oversold.
In this article, we backtest a rules-based RSI pullback strategy to see how it has performed historically, including its returns, win rate, drawdowns, and number of trades.
RSI Pullback Strategy
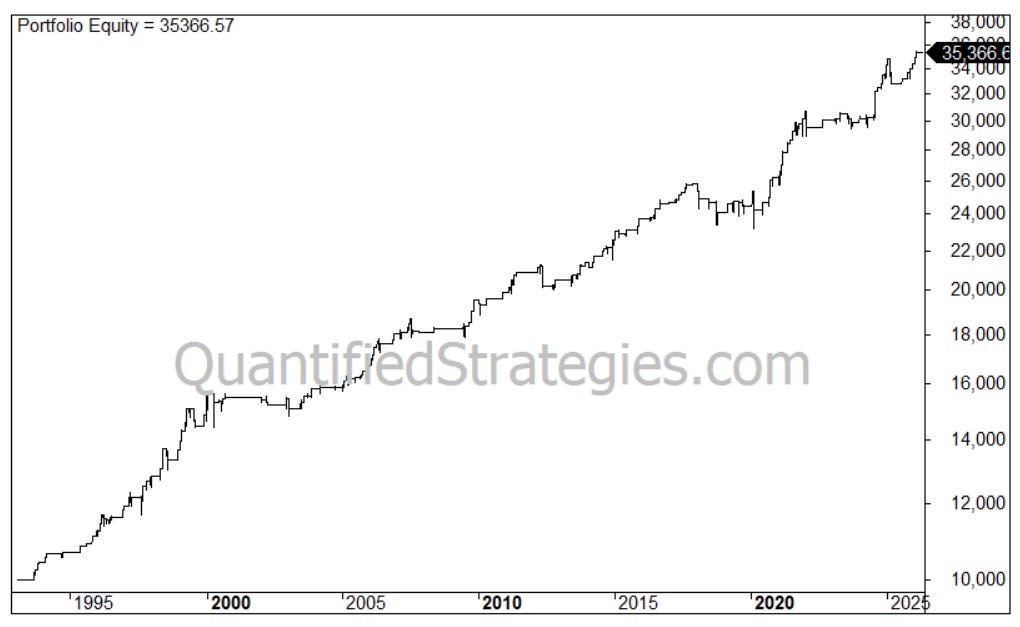
We backtested the strategy on SPY, the ETF that tracks the S&P 500:
Performance
No. of trades: 184
Average gain per trade: 0.7%
Win ratio: 78%
Profit factor: 2.8
Annual returns (CAGR): 3.9%
Exposure/time in the market: 8%
Risk-adjusted return: 50% (CAGR divided by time spent in the market (0.08))
Max drawdown: 10% (buy and hold 55%)
Trading Rules
We used the following trading rules: