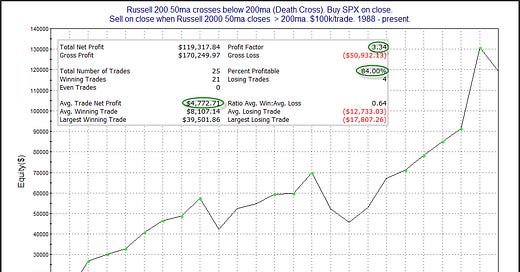
A Russell 2000 Death Cross occurs when the 50-day moving average of the Russell 2000 index crosses below its 200-day moving average. This is often seen as a bearish signal, but a new study by Rob Hanna on his blog QuantifiableEdges suggests otherwise. Let’s look at the Russell 2000 death cross trading strategy.
This is a strategy that is very easy to backtest, but we let Hanna’s results speak for itself. Please note that the backtest was performed on the respective cash indexes, not the ETFs.
Here is the summary of Rob Hanna’s findings:
* There have been 25 Russell Death Crosses since 1988.
* The S&P 500 rose in 21 of those cases (84%).
* The biggest winner was in 2020, when the S&P 500 gained 60.8%.
* The most recent Russell Death Cross occurred in 2022, and the S&P 500 has fallen since then.
* Drawdowns were generally sizable, even for the winners.
Below is the equity curve of the strategy (shown in the image)
We have a published the detailed data from the trading strategy here>>
https://www.quantifiedstrategies.com/russell-2000-death-cross-trading-strategy/


