

A simple moving average (SMA) is a simple average of the price of an asset over a specified period. The average is called “moving” because it is calculated continuously for any new price data recorded in each new trading session and plotted on the chart bar by bar, forming a line that moves along the chart as the average value changes.
We backtest the following trading rules:
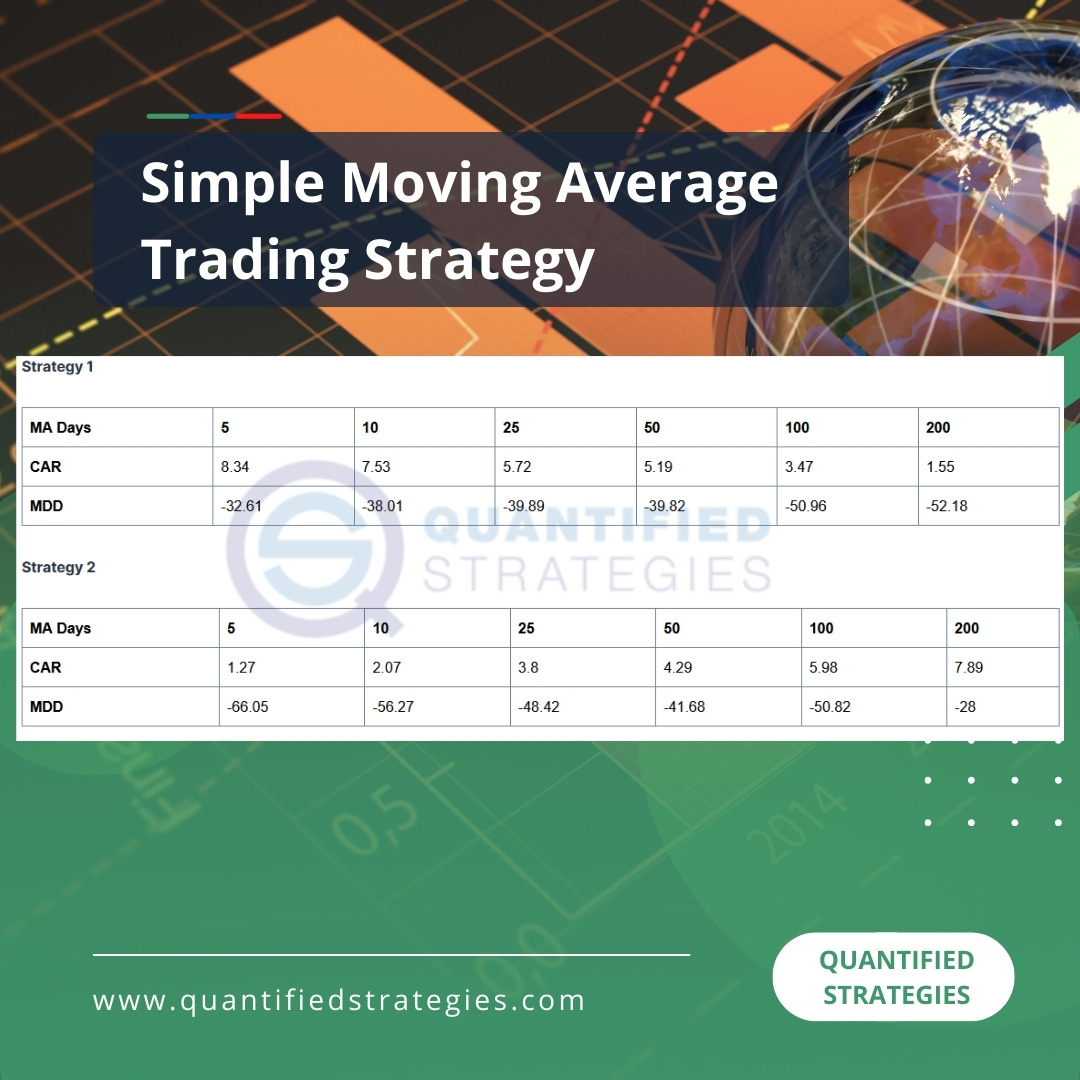
Strategy 1: When the close of SPY crosses BELOW the N-day moving average, we buy SPY at the close. We sell when SPY's closes ABOVE the same average. We use CAGR as the performance metric.
Strategy 2: Opposite, when the close of SPY crosses ABOVE the N-day moving average, we buy SPY at the close. We sell when SPY's closes BELOW the same average. We use CAGR as the performance metric.
Strategy 3: When the close of SPY crosses BELOW the N-day moving average, we sell after N-days. We use average gain per trade in percent to evaluate performance, not CAGR.
Strategy 4: When the close of SPY crosses ABOVE the N-day moving average, we sell after N-days. We use average gain per trade in percent to evaluate performance, not CAGR.
Strategy 1 and Strategy 2 returned the following results as shown in the image below.
We published the results of the Strategy 3 and Strategy 4 and how you can calculate a simple moving average here >>
https://www.quantifiedstrategies.com/simple-moving-average-trading-strategy/