
The 10 Best Candlestick Patterns - Ranked by Data
Forget Opinions – See the Candlestick Patterns That Stand Up to Backtesting

Today, we write a pretty long article where we present the 10 best candlestick patterns - ranked by data.
Candlestick patterns are everywhere. You see them in trading books, on charts, in YouTube tutorials, and across social media. Traders talk about engulfing patterns, dojis, haramis, and dozens of other formations as if they contain deep insight into market behavior.
But here is the uncomfortable truth:
Most candlestick patterns don’t work the way traders think they do.
Many of these patterns are taught using carefully selected chart examples. They look convincing in hindsight, but that doesn’t mean they produce consistent trading profits.
Instead of relying on opinions, anecdotes, or cherry-picked charts, we decided to test them properly.
We coded and backtested 75 different candlestick patterns using strict mechanical rules.
No discretion. No interpretation. No visual judgment.
Just data.
If you want the rules in plain English or the complete code to backtest yourself, please check out our website shop.
In this article, we reveal the ten best candlestick patterns based on real historical performance in the stock market.
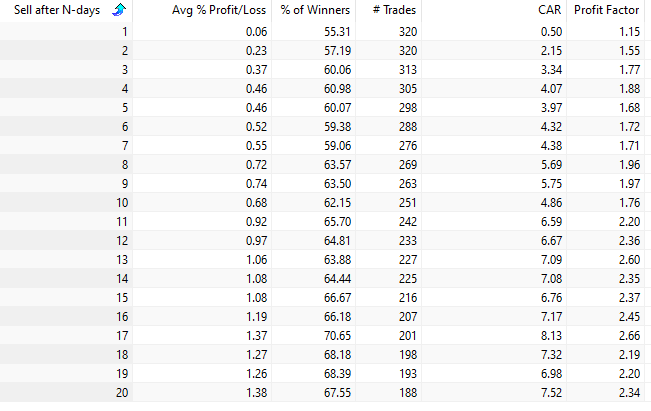
How We Tested 75 Candlestick Patterns
To evaluate candlestick patterns objectively, we converted each pattern into precise trading rules.
Every pattern was tested on the S&P 500, representing the broad U.S. stock market.
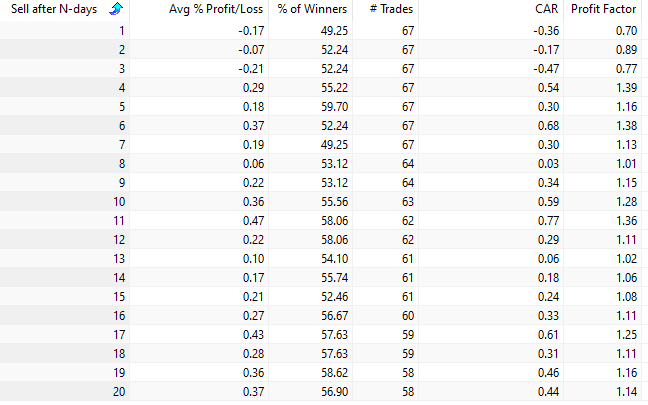
Whenever a pattern appeared, it triggered a buy signal. We then measured how the market performed over the following 1 to 20 trading days.

This produced twenty performance results for every candlestick pattern.
To make the results realistic, we also included trading costs of 0.03 percent per trade to account for slippage and commissions.
We then ranked the patterns using two metrics:
• Profit factor
• Annualized return
The ranking is based on the average of these two measures across all 20 holding periods.
What Is Profit Factor?
Profit factor is one of the most useful metrics when evaluating trading strategies.
It measures the relationship between a strategy’s total profits and total losses.
Profit Factor = Gross Profit / Gross Loss
If the value is above 1, the strategy is profitable.
The higher the number, the stronger the edge.
As a rule of thumb, we generally look for profit factors above 1.75 when evaluating trading systems.
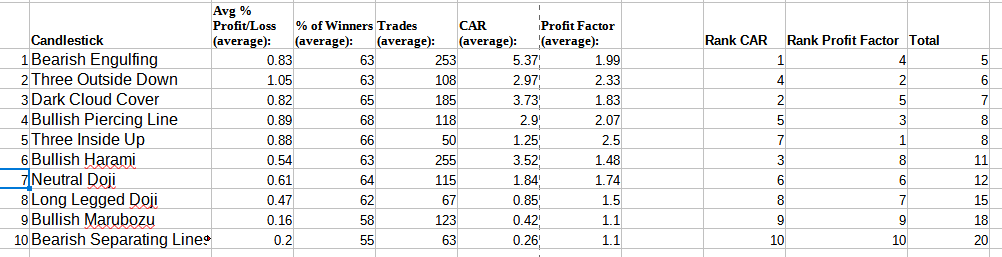
The 10 Best Candlestick Patterns - Backed By Data
After testing 75 different candlestick formations, we ranked them from worst to best.
Below are the ten patterns that performed the best in our tests.
10. Bearish Separating Lines
The bearish separating line is a two-candle formation.
It starts with a strong bullish candle, followed by a bearish candle that opens at the same price as the previous candle’s open.
Despite its bearish name, the pattern actually produces a short-term bullish signal in the stock market.
For example, holding the S&P 500 for ten trading days after the signal produced an average gain of about 0.36 percent across 63 trades.
However, the pattern does not occur frequently, which limits its contribution to overall returns.
9. Bullish Marubozu
The marubozu is one of the simplest candlestick patterns.
It consists of a single long candle with little or no upper and lower shadows.
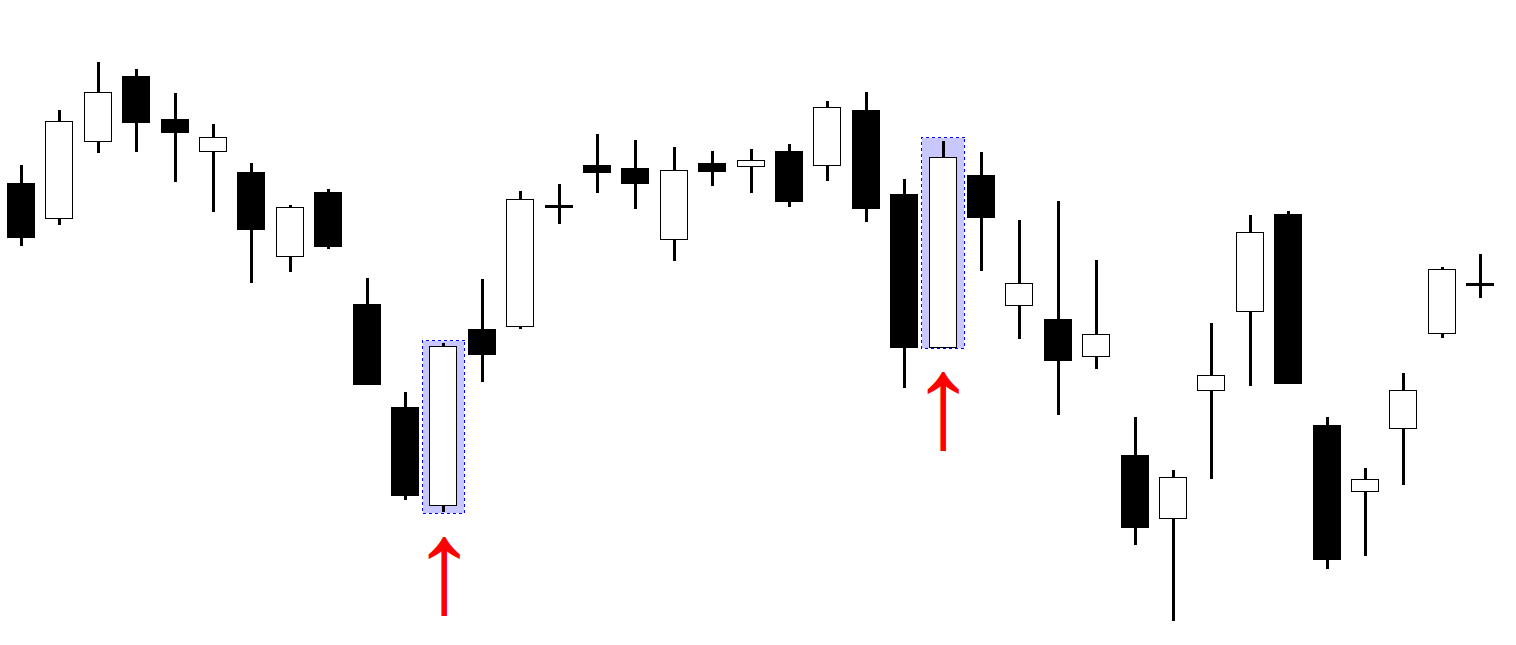
In theory, it signals strong buying pressure.
In practice, the pattern shows mixed short-term performance.
During the first few days after the signal, the average returns are slightly negative. Over longer holding periods the results turn positive, largely reflecting the general upward drift of the stock market.
8. Long-Legged Doji
The long-legged doji is often interpreted as a sign of uncertainty.
It features long upper and lower shadows with a very small body in the middle of the candle’s range.
This structure suggests a battle between buyers and sellers.
In our tests, however, the pattern appears relatively rarely and produces modest returns.
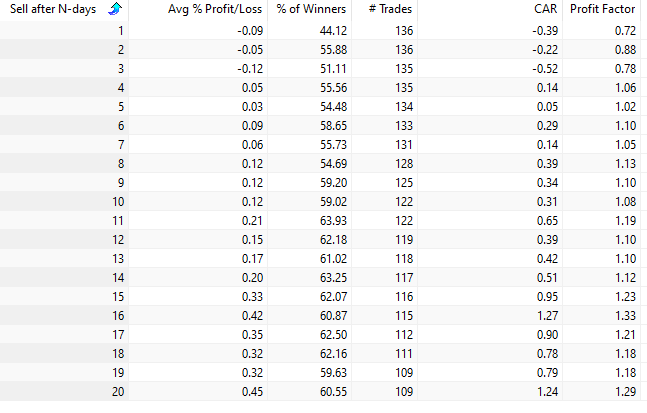
7. Neutral Doji
The neutral doji occurs when the opening and closing prices are nearly identical.
It often appears after a trend and is interpreted as a possible reversal signal.
In our tests the neutral doji produced results roughly in line with the stock market’s natural upward bias.
The main advantage of this pattern is that it occurs fairly often, providing a steady stream of signals.
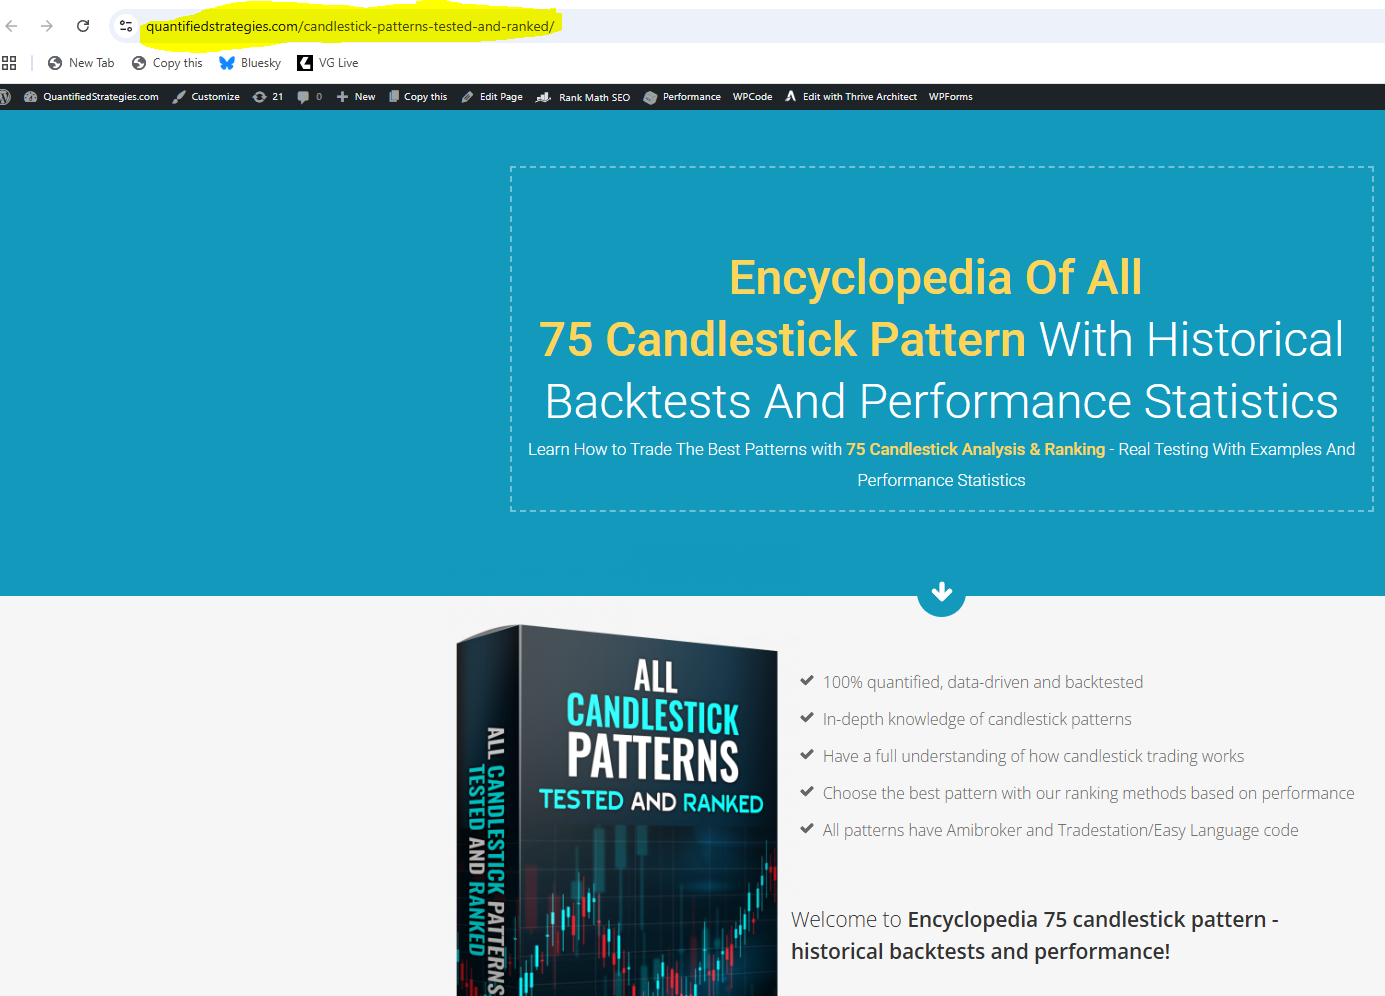
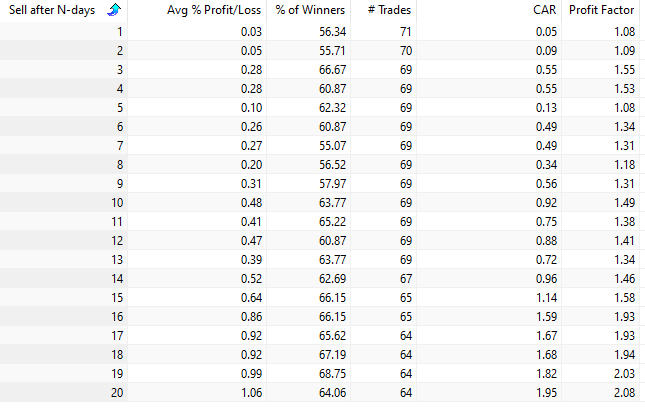
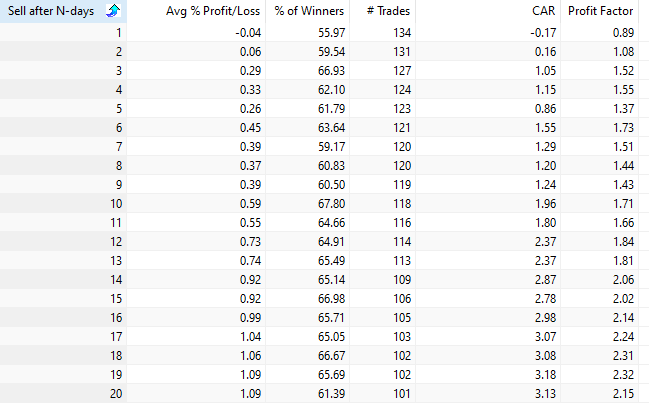
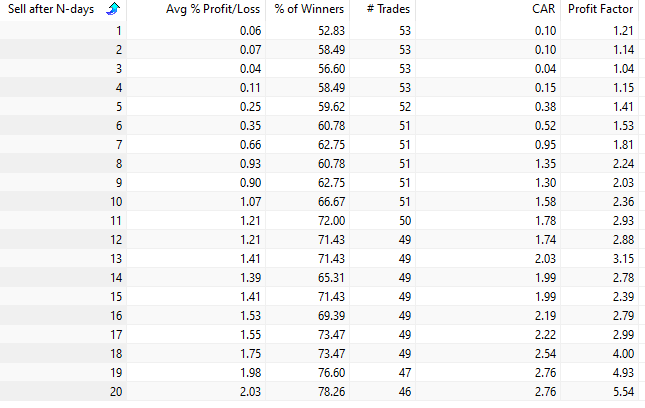
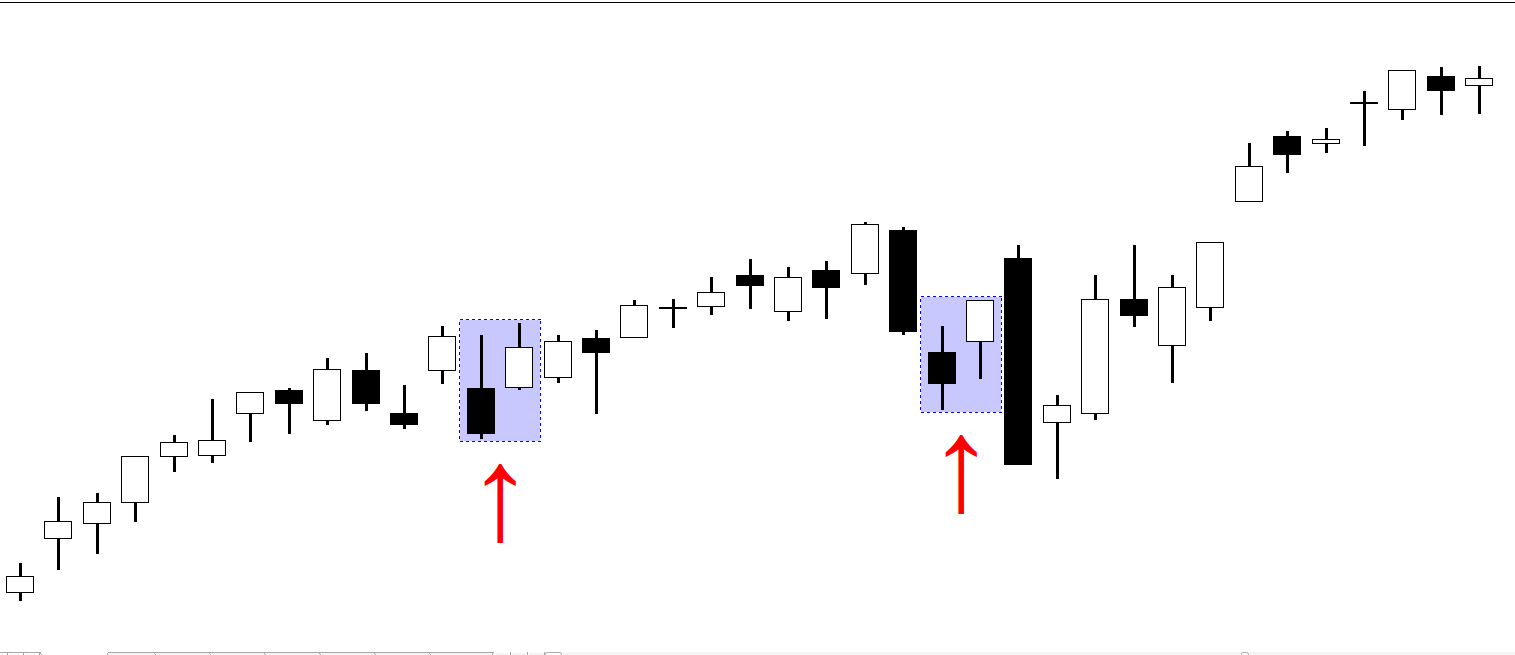
6. Bullish Harami
The bullish harami is a two-candle reversal pattern.
The first candle is bearish and relatively large. The second candle is small and bullish, and its entire body sits inside the previous candle’s body.
Among the ten best candlestick patterns, the bullish harami appears the most frequently.
It shows a slight edge during the first few days after the signal, but the advantage fades over longer holding periods.
5. Three Inside Up
The three inside up pattern consists of three candles.
The first two candles form an inside pattern, followed by a bullish breakout.
In our backtests, the pattern performs better than average when holding the market for more than ten trading days.
Over a 20-day period, the average return is roughly twice the normal market return for that timeframe.
However, the pattern appears relatively infrequently.
4. Bullish Piercing Line
The bullish piercing line is a two-candle pattern that often appears during a pullback within an uptrend.
It is typically interpreted as a bullish continuation signal.
In the short term, the performance is relatively weak.
Over longer holding periods, the returns are roughly in line with the overall upward drift of the stock market.
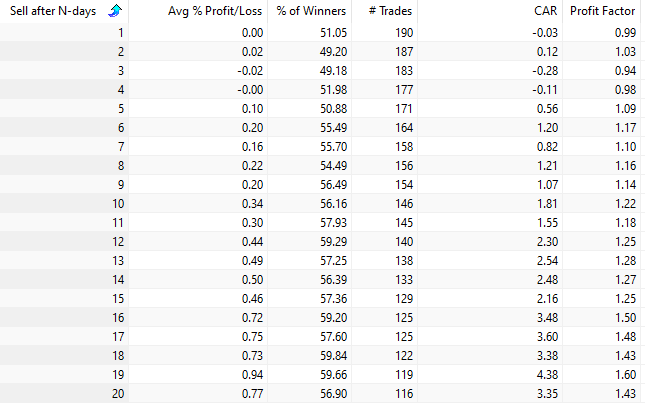
3. Dark Cloud Cover
The dark cloud cover is another two-candle formation.
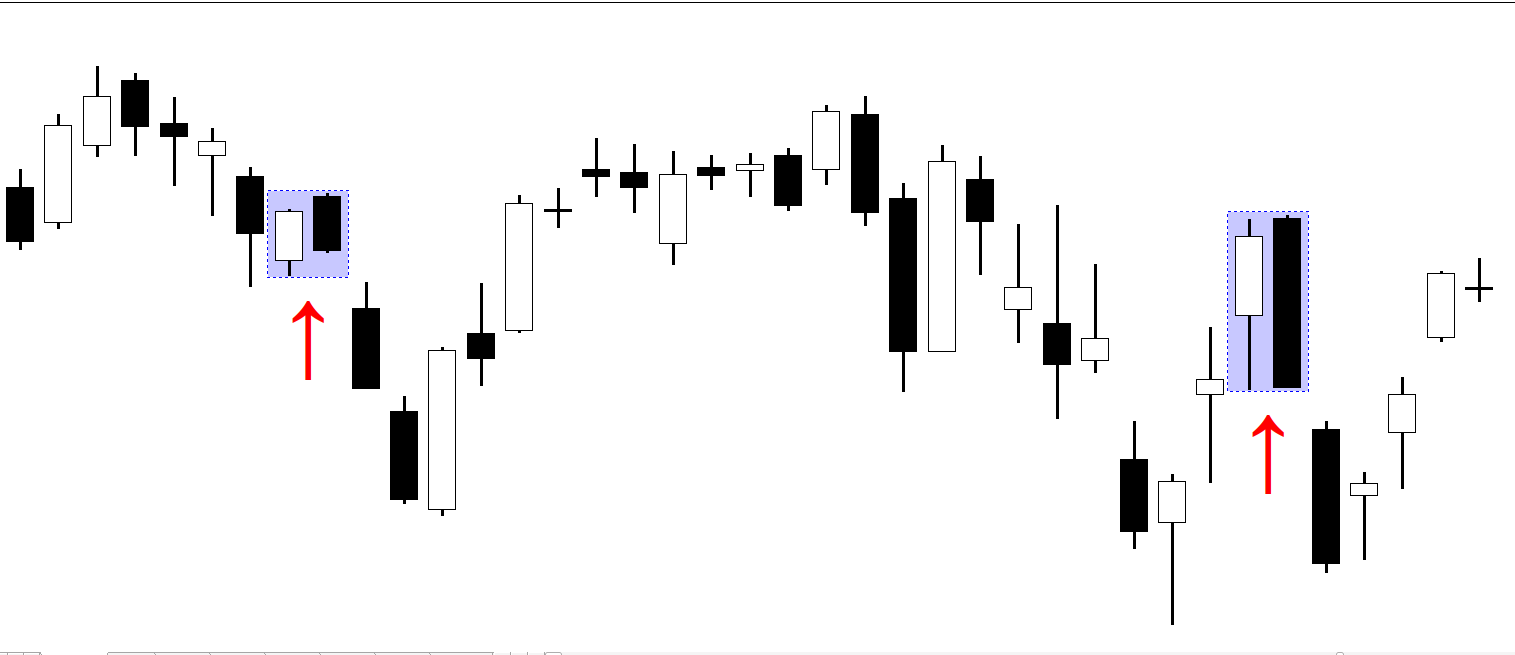
The first candle is strongly bullish. The second candle gaps higher at the open but then reverses and closes below the midpoint of the first candle.
Despite its bearish appearance, the pattern works well as a bullish mean-reversion signal.
It performs consistently across several holding periods and also appears often enough to generate multiple trades per year.
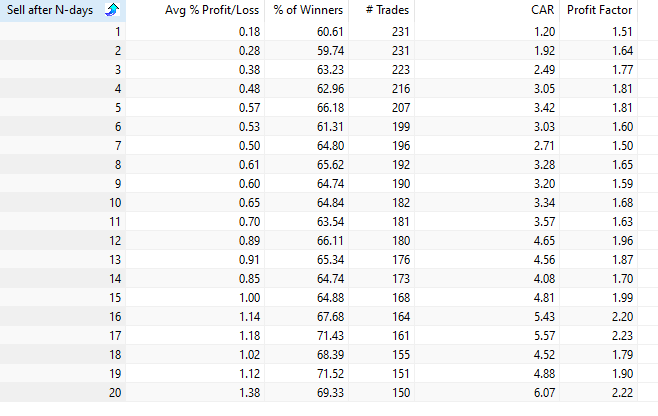
2. Three Outside Down
The three outside down pattern unfolds over three candles.
It usually appears after a strong rally and signals a potential reversal.
In our backtests, the pattern produces strong short-term mean reversion.
For example, after three trading days the average gain per trade is approximately 0.58 percent.
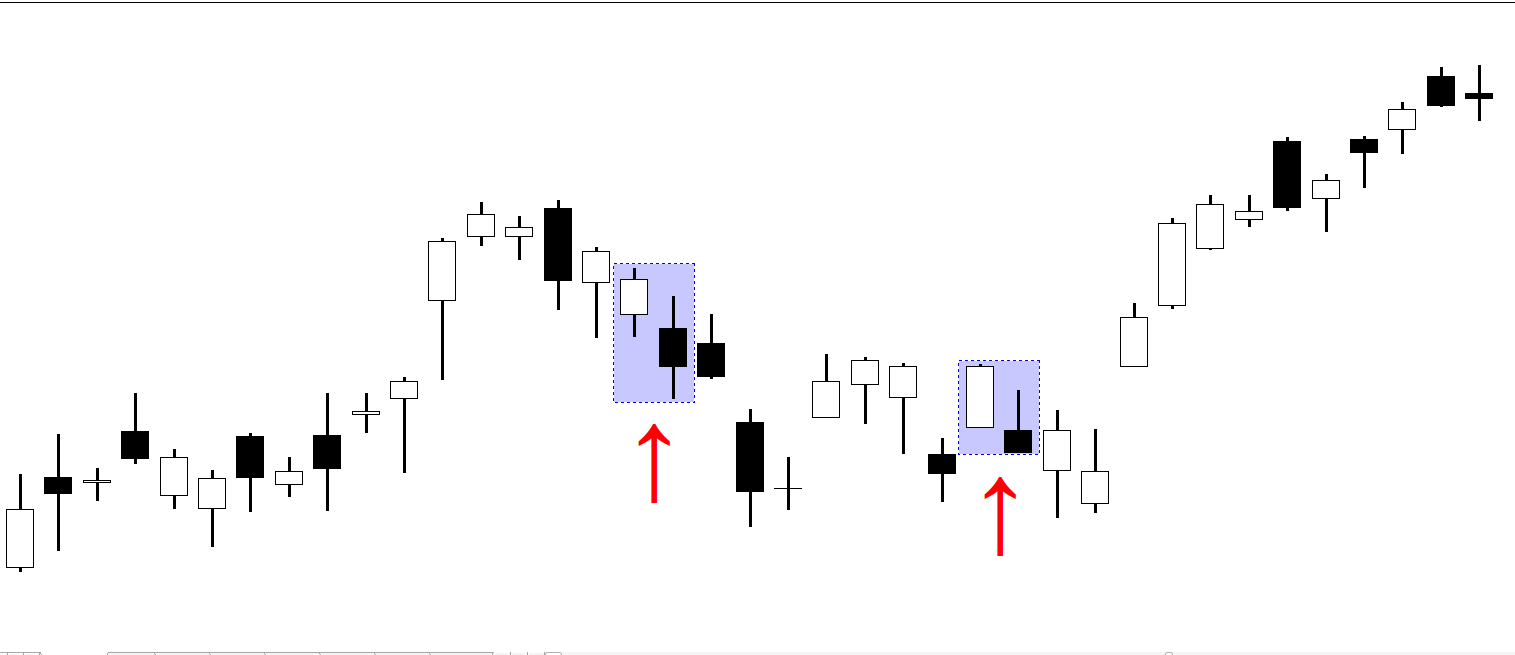
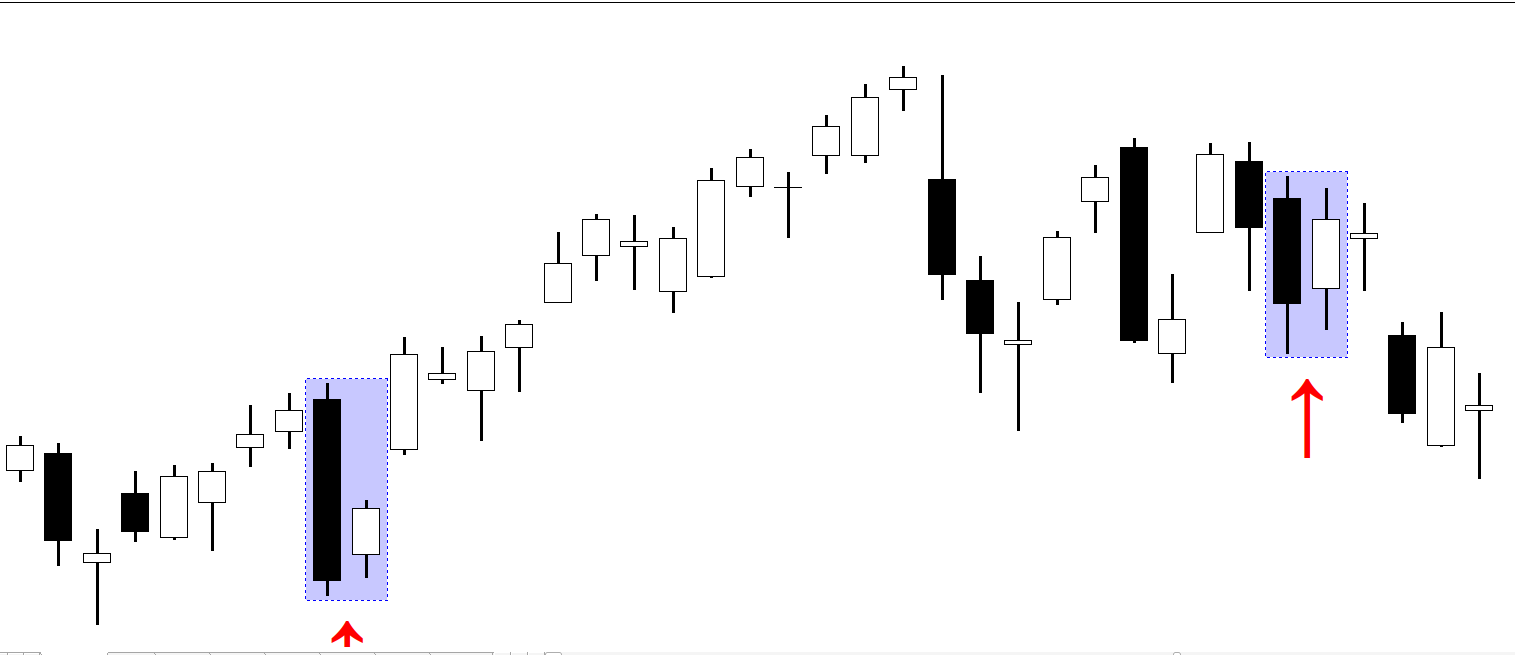
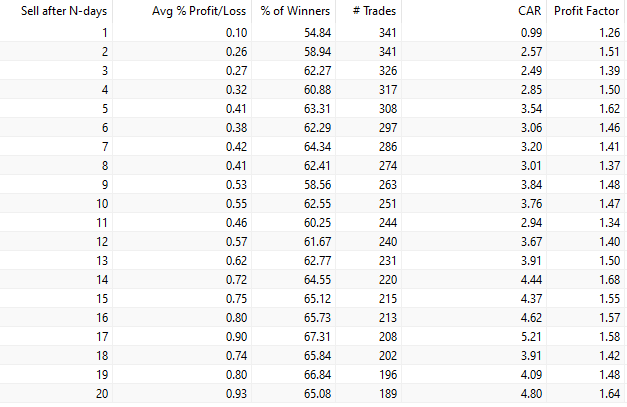
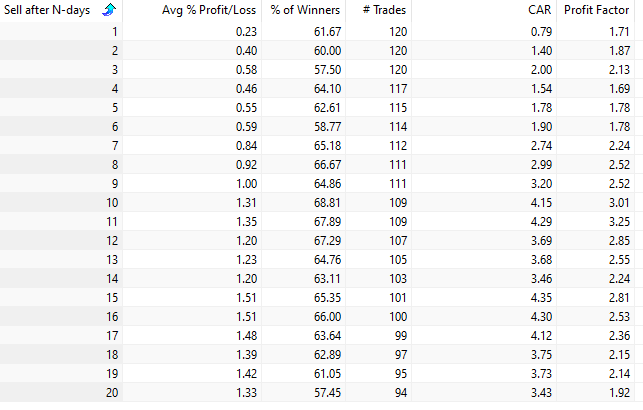
1. Bearish Engulfing — The Best Candlestick Pattern
The best-performing pattern in our entire study is the bearish engulfing pattern.
Despite its bearish name, it works extremely well as a bullish signal in the stock market.
This reflects an important characteristic of equities: short-term mean reversion.
After a sharp move down, the market often rebounds.
The bearish engulfing pattern consists of two candles:
A bullish candle followed by a larger bearish candle that fully engulfs the previous candle’s body.
The pattern occurs frequently and produces strong performance across multiple holding periods.
If the market is held for five trading days after the signal, the average gain is approximately 0.46 percent - more than double the average five-day return of the market.
10 Best Candlesticks Backtested And Ranked
We have now shown you the ten best candlestick patterns, all quantified and ranked.
They vary in both performance and the number of fills.
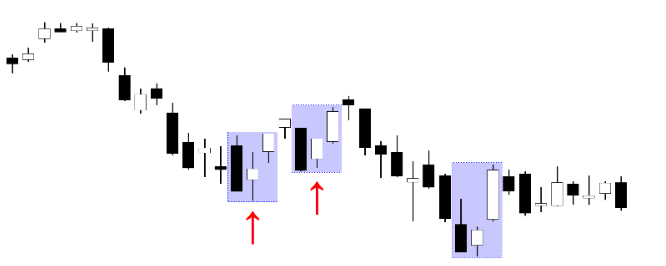
Combining The Best Candlestick Patterns Into a Strategy
Individual candlestick patterns can provide useful signals.
But the results become more interesting when several of the best patterns are combined into one strategy.
When we combine the five best patterns and modify the exit rule, the performance becomes surprisingly robust.
Instead of exiting after a fixed number of days, the strategy exits when the closing price moves above the previous day’s high.
Starting with $100,000 in 1993, the strategy grew to roughly $1.4 million.
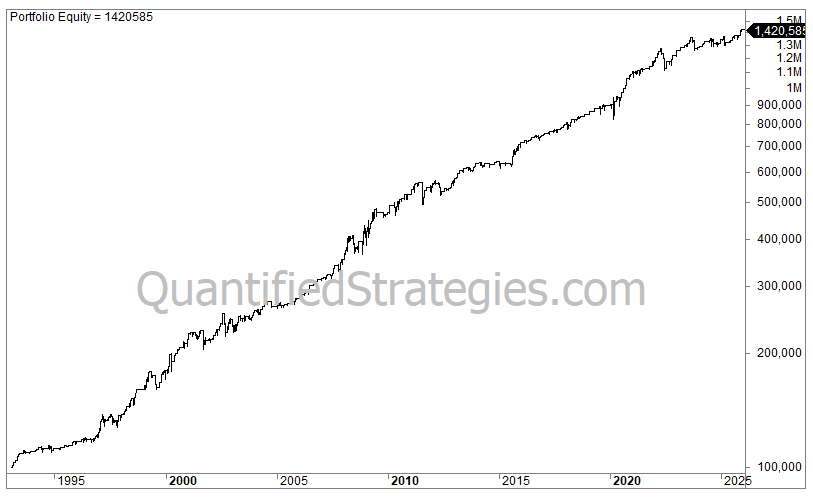
Key statistics include:
Average gain per trade: 0.5 percent
Win rate: 74 percent
Maximum drawdown: 13 percent
Annual return: 8.3 percent
Interestingly, the strategy is invested only about 20 percent of the time.
Can Candlestick Strategies Be Improved?
Yes.
Candlestick patterns are rarely powerful on their own, but they can become significantly more effective when combined with filters.
Examples include:
moving averages
momentum indicators such as RSI
market regime filters
These additions can improve both returns and risk-adjusted performance.
It is also worth noting that candlestick patterns tend to work best in stocks and equity indices. Their performance is generally weaker in markets such as forex or commodities.
Final Thoughts
Candlestick patterns have been part of trading for centuries, but surprisingly few traders backtest them.
By coding and backtesting 75 different patterns, we were able to identify which ones actually show measurable edges.
The ten patterns above represent the strongest performers in our research.
If you want to explore the full study, including all 75 candlestick patterns, their exact trading rules, and the complete trading code, you can find it on our website.
Everything is rule-based and transparent, allowing you to verify the results of the 10 best candlestick patterns or implement the strategies in your own trading system.