
The Supertrend Indicator Backtested

In today’s article on algorithmic trading, we examine the Supertrend Indicator and backtest whether this popular trend-following tool lives up to its name.
The Supertrend is designed to identify the direction of the prevailing trend. It plots a line either above or below price, depending on market direction and volatility. The indicator is based on the Average True Range (ATR), which makes it responsive to changes in market volatility.
How the Supertrend Indicator Is Calculated
The Supertrend Indicator starts with the median price, which is calculated as the average of the high and low of each bar:
Median Price = (High + Low) / 2
From this value, two bands are created:
Upper Band = Median Price + (Multiplier × ATR)
Lower Band = Median Price - (Multiplier × ATR)
Olivier Seban, who developed the Supertrend Indicator, suggested using a 10-period lookback together with a multiplier of 3.
Although the calculation produces both an upper and a lower band, only one line is displayed on the chart at any given time. The indicator switches between the two bands according to its trend rules. In practice, the lower band is not allowed to move lower during an uptrend, while the upper band is not allowed to move higher during a downtrend.
The Trading Strategy
The strategy uses simple, non-optimized rules. This is important because excessive optimization can easily lead to curve fitting, where a strategy looks good in a backtest but performs poorly in live trading.
Here is an example trade:
A buy signal was triggered on May 29, 2020, when the S&P 500 traded at 3,044.31. The sell signal came on January 21, 2022, at 4,397.94. This produced a gain of 1,353.63 points, equal to a profit of 44.46%.
Backtest Results: 1960 to Present
We tested the Supertrend strategy on the S&P 500 using weekly data going back to 1960. The results show why trend-following strategies can be useful when applied systematically.
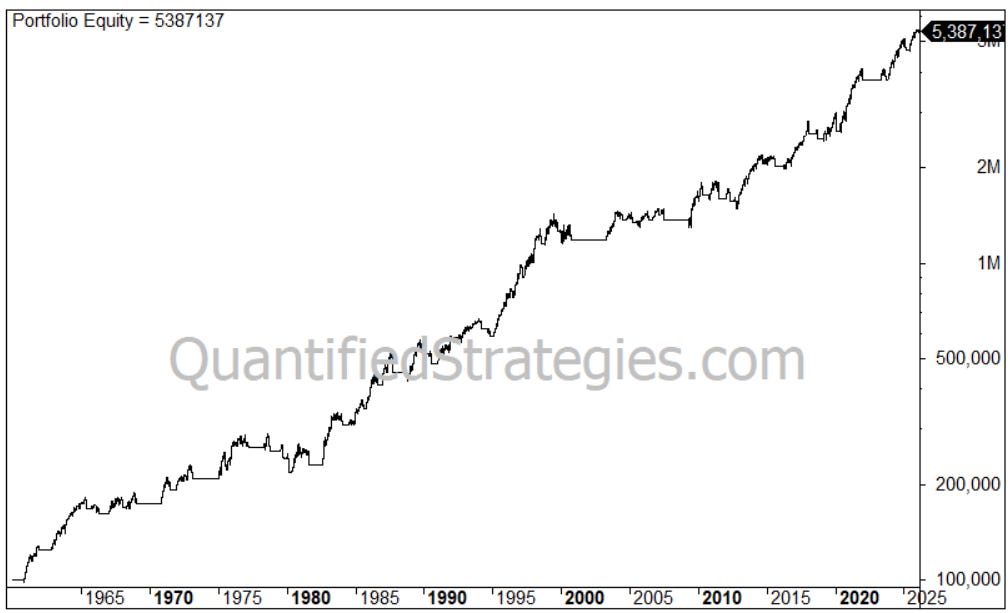
A $100,000 investment would have grown to almost $5.4 million, excluding dividends.
The strategy generated a win rate of 68% across just 41 trades.
The maximum drawdown was 25%, which is considerably lower than a traditional buy-and-hold approach.
Because the strategy was invested only 63% of the time, the risk-adjusted return was 9.8%, outperforming buy and hold on that basis.
Backtesting the Supertrend Indicator
The main strength of the Supertrend Indicator is that it helps traders stay invested during large trends while also reducing exposure during major market declines.
However, the indicator is not perfect. Like most trend-following tools, it struggles in sideways and choppy markets. During these periods, the price can move back and forth across the indicator line, creating whipsaws and a series of small losses.
For this reason, the Supertrend Indicator should not be used blindly as a standalone strategy. It works best when traders understand its strengths, weaknesses, and the type of market environment in which it is most likely to perform well.
Overall, the backtest suggests that the Supertrend Indicator can add value as a systematic trend-following tool, especially when tested over long market histories and used with clear trading rules.
Trading Rules
