
This Simple Trading Rule Can Make You Money

This simple trading rule can make you money (according to Paul Tudor Jones and the MLM trend following index):
Imagine making $100 million in just one day. That’s exactly what Paul Tudor Jones did during the 1987 crash.
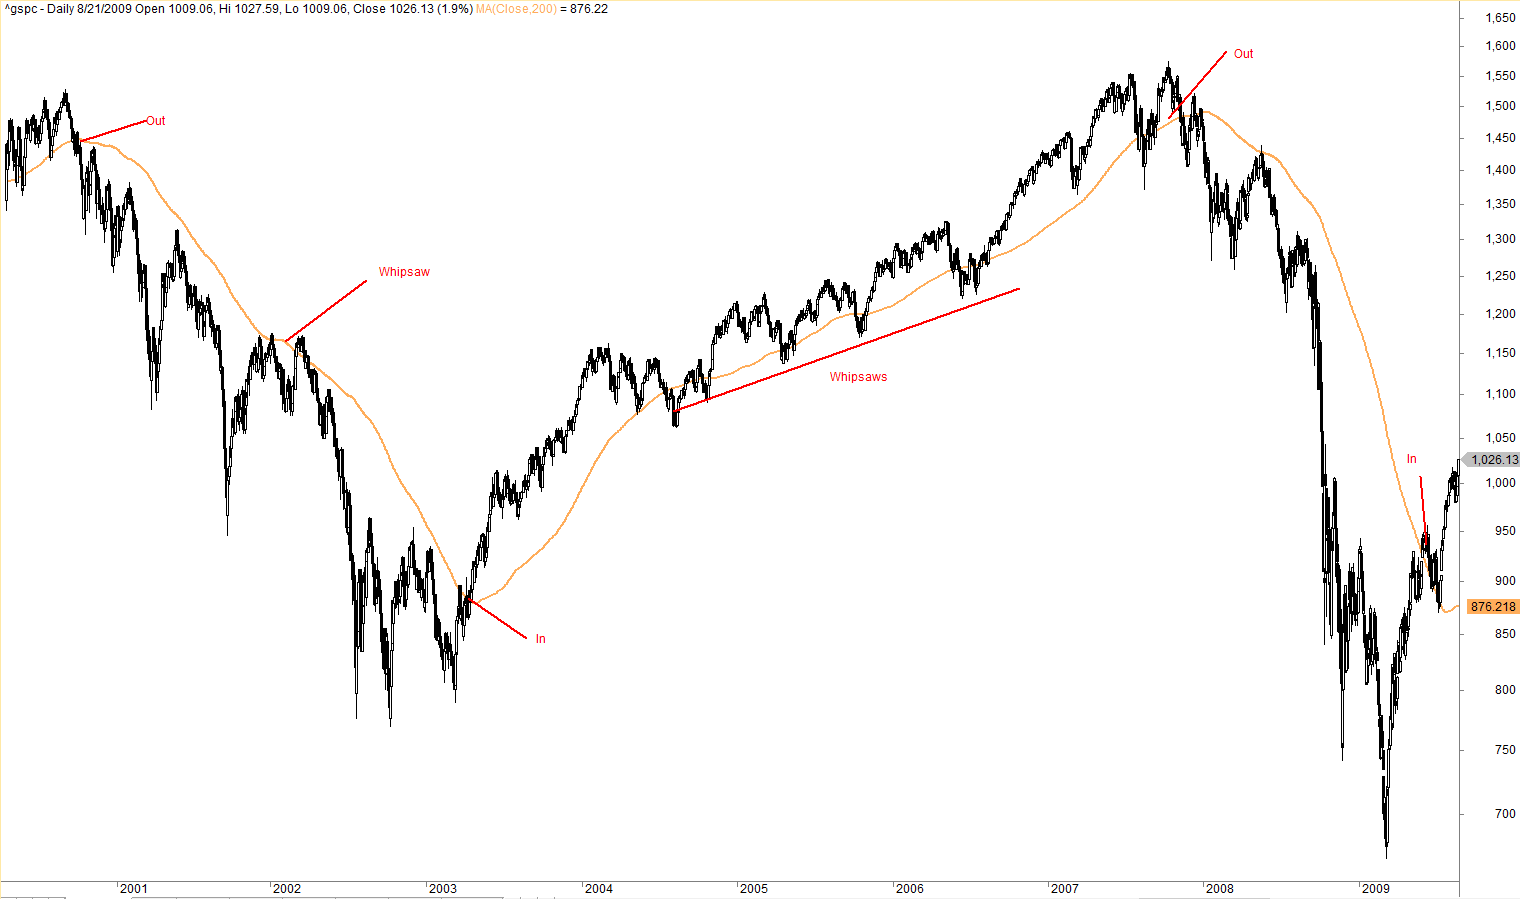
But here’s the real secret: His strategy was simple. He followed the 200-day moving average.
Price above: Stay in the market (buy).
Price below: Get out (sell).
That one rule helped him avoid massive crashes and protect capital. In fact, this filter kept traders out of the dot-com crash and the 2008 financial crisis.
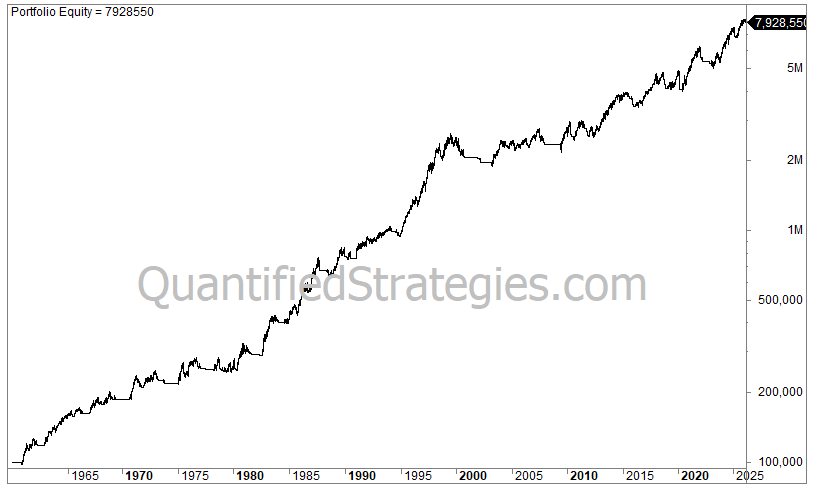
This is the S&P 500 during “the lost decade”:
Returns were similar to buy and hold since 1960, but with way less drawdown:
Do you need more proof? Does the rule work on other assets?
Let’s look at the MLM index
What is the MLM Index?
MLM (Mt. Lucas Management Index) uses one indicator: The 200-day moving average! They use a moving-average crossover across 25 commodity markets (equally weighted).
When the price at the end of the month is above the 200-day moving average, a long position is held for the next month. If the price is below the moving average, a short position is held. Can it get any simpler?
There are 25 futures contracts in seven major categories in the MLM Index:
Grains (corn, soybeans, soybean meal, soybean oil, and wheat),
Livestock (live cattle),
Energy (heating oil, crude oil, natural gas, and unleaded gasoline),
Metals (gold, silver, and copper),
Food and fiber (coffee, cotton, and sugar),
Financials (5-year Treasury notes, 10-year Treasury notes, and Treasury bonds),
Currencies (Australian dollars, British pounds, Canadian dollars, German Marks, Swiss francs, and Japanese yen)
Note that no stock market indices are included (read more about trend-following in stock indices below).
How has this straightforward method performed?
The MLM index dates back to the 1960s. David Aronson, in his book called Evidence-Based Technical Analysis (a very good book), made some graphics of the performance up until 2005:

As you can see, the annual returns are roughly in line with those of stocks, despite having less “risk”. The second graph shows that the MLM index has beaten stocks on a risk-adjusted basis (please read our article on trading strategy and system performance metrics to better understand risk).
Even better, the performance is only weakly correlated with stocks, thus offering strategy diversification.