
Trend Following Strategy in S&P 500: (Meb Faber and Paul Tudor Jones)

Go long the S&P 500 when the price crosses the 200-day moving average, and sell when it crosses below the 200-day average. This is probably not the most sensational strategy, to say the least. However, Faber’s article is a great read because of his “simple” ideas, yet very powerful.
This strategy is so simple that it’s easy to dismiss. We have dismissed it many times, and we have not looked at the strategy for about 7-8 years. The temptation to develop more powerful and complex strategies is always lurking in the back of any trader’s head.
We backtest the following trading rules:
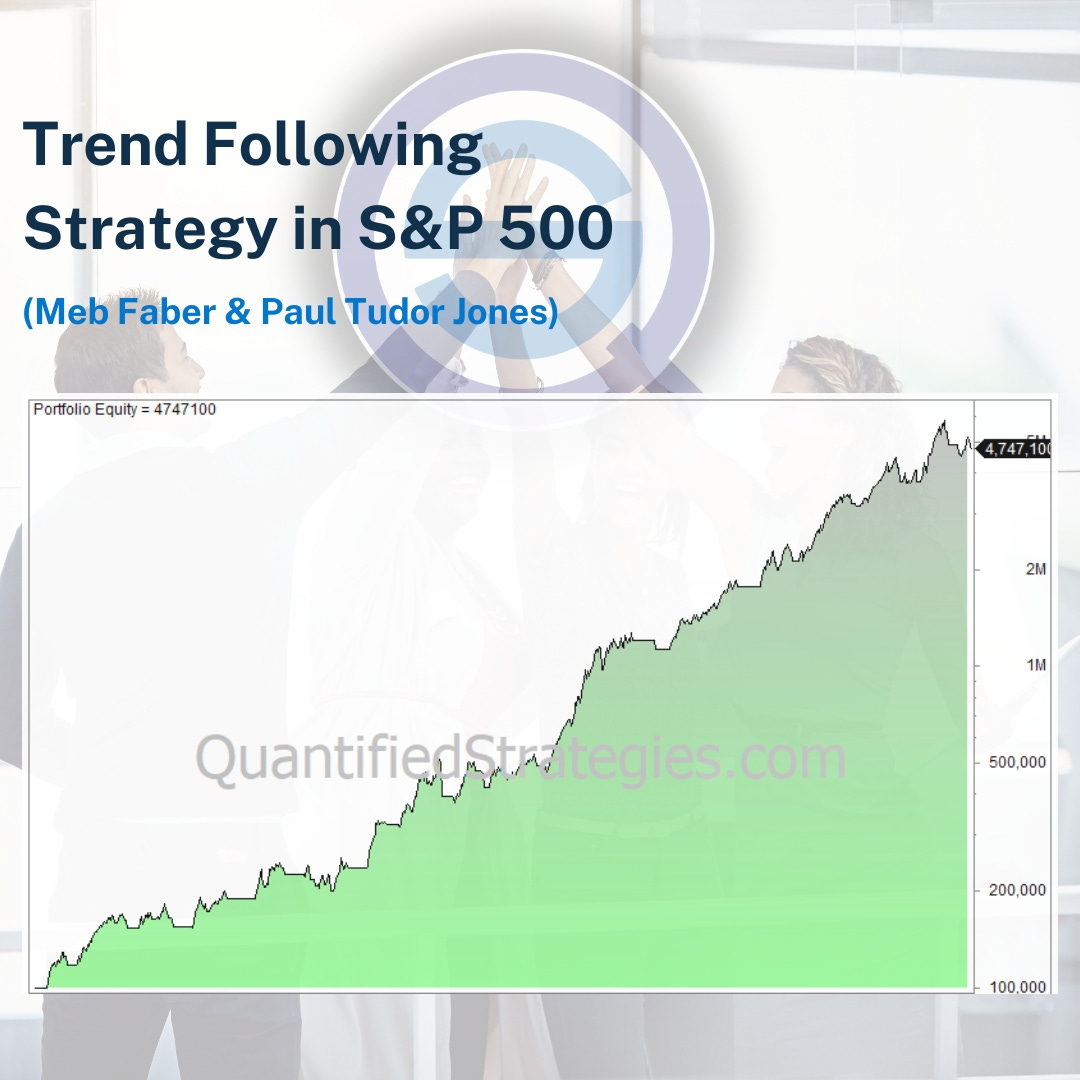
We buy when the close is above the 200-day moving average, and sell when it crosses below. The logarithmic equity curve above has a max drawdown of 28%, reached in 2002, and the CAGR is 6.45% while buy & hold is 7% (the test is not adjusted for dividends). S&P 500 trends little in the short term, but in the long term, it trends upward.
We test how a 200-day moving average performs on the S&P 500 from 1960 until today. The equity curve looks like the image shown below.
We use monthly data to see how the strategy perform. Check out the performance here >>
https://www.quantifiedstrategies.com/trend-following-system-sp-500/