
Triple Top Chart Pattern Trading Strategy Explained — Does It Work? (Backtest Analysis)

The triple top chart pattern is a reversal pattern that predicts a potential change in the direction of the trend from an uptrend to a downtrend. It consists of three swing highs that end roughly around the same level and two intervening swing lows. The line connecting the two swing lows is called the neckline, the breakdown of which completes the pattern and indicates a potentially bearish move.
To trade the Triple Top pattern, you have to wait for the pattern to be confirmed by a break below the support level. Then, you may place a market sell order or a limit sell order at the breakout level if the breakout candlestick is too long.
You might put a stop-loss order above the resistance level formed by the triple top to limit potential losses in case the trade doesn’t go as expected. However, most backtest reveal that stop-losses make a strategy perform worse.
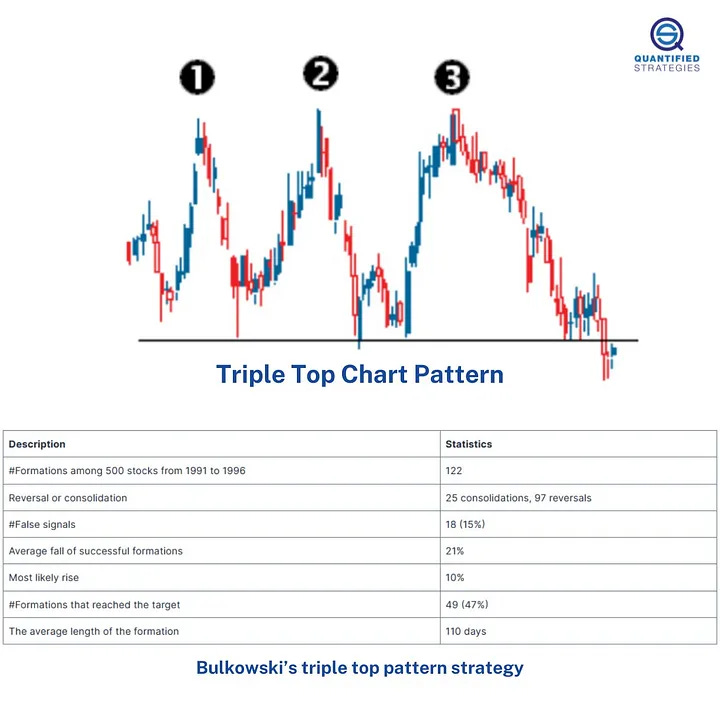
Bulkowski, an engineer, sat down and went through technical formations for 500 stocks over five years. This gave a total database of 2 500 years, although there are sources of error as all the stocks are from the same time period. He registered over 15 000 technical formations.
Bulkowski’s triple top pattern strategy is summarized in the table below.
You can find more info about this trading strategy here:
https://www.quantifiedstrategies.com/triple-top-chart-pattern-trading-strategy/