
Williams Percent R Indicator: Complete Guide for Traders
Introduction to the Williams %R Indicator

The williams percent r indicator is a momentum oscillator developed by American trader Larry Williams in 1973. Its primary purpose is straightforward: identify overbought and oversold conditions in financial markets by measuring where the current closing price sits within a recent high low range.
Unlike most oscillators that run from 0 to 100, Williams %R operates on an inverted scale from 0 to -100. This makes it mathematically equivalent to the fast stochastic oscillator, just flipped upside down. Readings near 0 indicate the close is near recent highs (overbought territory), while readings near -100 show the close hugging recent lows (oversold territory). The standard look back period is 14 periods, applicable across stocks, forex, indices, and cryptocurrencies on any timeframe.
Why do traders still rely on this decades-old tool? Simplicity and speed. Williams %R has no smoothing component, which means it reacts quickly to price movements without the lag that moving average-based indicators introduce. It integrates seamlessly with other technical analysis tools, making it a valuable tool for timing entry and exit points in your trading decisions.
What Is the Williams Percent R Indicator?
The williams percent range indicator is a bounded momentum oscillator that compares the most recent closing price to the highest price and lowest price over a defined time period. This comparison reveals whether buying pressure or selling pressure currently dominates the underlying security.
The scale works as follows:
0 to -20: Overbought zone (price near the top of the range)
-20 to -80: Neutral territory
-80 to -100: Oversold territory (price near the bottom of the range)
The indicator moves between these fixed boundaries, never exceeding 0 or falling below -100. This bounded nature makes interpretation consistent across all markets and timeframes.
Williams %R draws exact same lines as the Fast Stochastic %K, but inverted. A Stochastic reading of 80 becomes -20 on the williams r indicator. Larry Williams originally applied it to futures trading in the 1970s and famously won the 1987 Robbins World Cup Championship with over 11,000% returns—a track record that helped establish this tool’s credibility in technical analysis.
Williams %R Formula and Calculation
The formula for Williams %R is:
%R = -100 × (Highest High − Close) ÷ (Highest High − Lowest Low)
Each component is defined as:
Highest High: Maximum price reached over the look back period (typically 14 bars)
Lowest Low: Minimum price reached over the same period
Close: The current closing price of the most recent bar
Example Calculation (EUR/USD, 14-period):
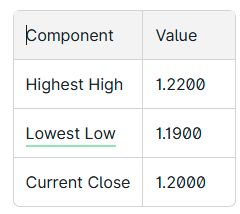
Step-by-step:
Numerator: 1.2200 − 1.2000 = 0.0200
Denominator: 1.2200 − 1.1900 = 0.0300
Ratio: 0.0200 ÷ 0.0300 = 0.6667
%R = -100 × 0.6667 = -66.67
This raw value falls in neutral territory. If the close rose to 1.2150, %R would calculate to -16.67 (considered overbought). A drop to 1.1950 yields -83.33 (considered oversold).
Most charting platforms calculate this automatically, but understanding the math helps you interpret momentum shifts and diagnose anomalies like gaps or thin trading volumes.
Default Settings and Look-Back Periods
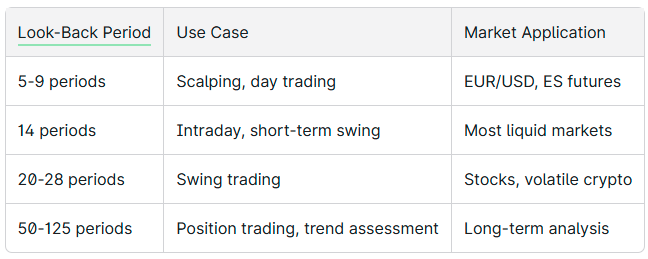
The classic default is 14 periods—14 days on daily charts or 14 candles on intraday timeframes. This setting balances sensitivity with reliability across most markets.
Shorter settings (5, 7, 9 periods): Generate faster trading signals but increase noise and more false signals. Best suited for scalping and day trading in high-liquidity environments.
Longer settings (20, 28, 50, 125 periods): Smooth out price action, reducing whipsaws at the cost of delayed entries. Appropriate for swing trading and position trading.
Test multiple look-back periods on your preferred trading range and avoid over-optimization on fewer than 500 bars of historical data.
How to Read Williams %R Values
The key interpretation zones define how you respond to r readings:
0 to -20: Overbought readings—close in the upper half of the range, near the highest price
-80 to -100: Oversold readings—close in the lower portion, near the lowest low
-20 to -80: Neutral zone where no extreme action is expected
The -50 midline serves as a practical dividing point. Values above -50 indicate price trading in the upper half of the recent range (bullish bias). Values below -50 suggest the lower half dominates (bearish bias).
Critical understanding: Overbought conditions do not automatically mean “sell,” and oversold market conditions do not mean “buy.” These readings simply indicate proximity to recent extremes.
In a strong uptrend, Williams %R can repeatedly stay above -20 for an extended period without triggering a meaningful trend reversal. During the 2020-2021 S&P 500 bull run, the indicator frequently pinned near overbought levels while price continued climbing. Similarly, strong downtrends see %R hugging below -80 for weeks, as observed during 2022 bear markets.

Using Williams %R for Overbought and Oversold Signals
The standard signal logic treats extreme readings as potential exhaustion points. When the indicator moves above -20 after a sustained rally, it suggests the overbought threshold has been reached. When it drops below -80 following a decline, the oversold threshold signals potential seller exhaustion.
Mean-reversion approach:
Identify price touching support or resistance while Williams %R shows extreme readings
Wait for the indicator to leave the extreme zone (cross back below -20 or above -80)
Enter in the direction of mean reversion with confirmation
Confirmation from price patterns (candlestick reversals, trendline breaks) or other indicators (RSI below 30, MACD bullish cross) significantly reduces false signals. Without confirmation, you risk premature entries against the current trend.
Market context matters: In range bound markets and choppy markets, these overbought or oversold signals tend to produce reliable mean-reversion opportunities. The 2023 consolidation phase in major indices saw multiple -80 bounces at support with 70-80% success rates in backtests.
However, in trending markets, acting on every extreme reading leads to frequent stop-outs. Overbought or oversold territory can persist far longer than most traders expect.
Williams %R as a Trend and Momentum Tool
Beyond identifying extremes, Williams %R can classify trend direction when using longer time period settings. A 63-period (quarterly) or 125-period (semi-annual) williams r provides broader context.
Trend identification rules:
Readings consistently above -50: Uptrend—price making higher highs and higher lows
Readings consistently below -50: Downtrend—price making lower highs and lower lows
Traders combine a long look-back Williams %R with a shorter one for dual-timeframe analysis. A 125-day reading above -50 establishes bullish bias (long-only trades), while a 14-day reading identifies pullback entries within that trend.
Spotting weakening momentum: When an uptrend fails to revisit prior overbought readings (each rally peaks at lower %R values), buying pressure is fading. This pattern preceded TSLA’s 2021-2022 transition from a persistent bull trend to sideways consolidation.
Similarly, a downtrend showing failure to revisit prior oversold levels hints at waning selling pressure and potential reversal.
Williams %R Trading Strategies
Williams %R works best within a complete trading plan that includes risk management, position sizing, and higher-timeframe context. The indicator alone does not constitute a strategy—it provides one input among several.
The following strategy archetypes represent common applications. Each requires confirmation, defined exit signals, and stop-loss placement based on price structure rather than the oscillator line.
Range-Trading Strategy with Williams %R
Setup: Identify a sideways market with defined horizontal support and resistance on a higher timeframe.
Long entry rules:
Price approaches support
Williams %R crosses back above -80 after spending time in oversold
Enter on the cross with stop below support (1-2% risk)
Take-profit at resistance
Short entry rules:
Price nears resistance
Williams %R crosses back below -20 after being in the overbought zone
Enter on the cross with stop above resistance
Take-profit at support
This approach performs best during low-volatility phases with minimal news catalysts. The 2023 consolidation periods in indices like the S&P 500 offered multiple clean range-trading setups.
Trend-Following Pullback Strategy
Filter: Use a moving average (50-day or 200-day SMA) to confirm trend direction.
Uptrend entries:
Price above 200 SMA (confirming uptrend)
Wait for Williams %R to dip below -80 (pullback)
Enter when %R crosses back above -50
Stop below most recent swing low
Partial profits at prior resistance levels
Downtrend entries:
Price below 200 SMA (confirming downtrend)
Wait for %R to rally above -20
Enter short when %R falls back below -50
Stop above most recent swing high
Backtests of 2020-2021 trending phases showed 55-65% win rates with 1.5:1 reward-to-risk ratios using this framework.
Divergence and Momentum Shift Strategy
Bullish divergence: Price makes a lower low while Williams %R makes a higher low within the oversold region. This signals fading selling pressure and potential reversal.
Bearish divergence: Price makes a higher high while Williams %R makes a lower high near overbought. This indicates weakening momentum on the buy side.
Entry protocol:
Identify divergence pattern
Wait for price confirmation (break above minor resistance for longs, below minor support for shorts)
Enter with stop beyond the divergence swing point
Warning: Divergence can persist in strong trends. EUR/USD showed bearish divergence patterns in 2022 that took weeks to resolve. Use smaller position sizes when trading divergence signals.
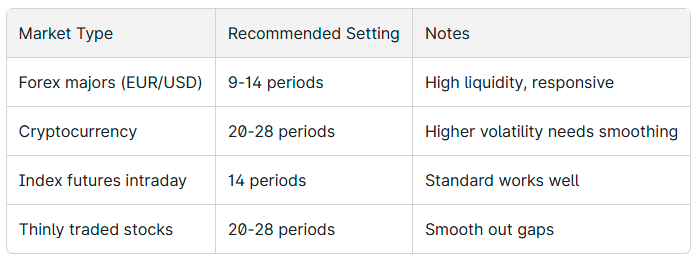
Adjusting Williams %R for Different Markets and Timeframes
Different financial markets require different settings based on volatility, liquidity, and session structure.
Session structure considerations: U.S. stock market hours (9:30-16:00 ET) create distinct intraday patterns. Pre-market and after-hours data can skew Williams %R readings, making regular session analysis more reliable.
Multi-timeframe approach: Use Williams %R on a daily chart to define bias (above/below -50), then drop to 15-minute or 1-hour charts to fine-tune entries. A 14-period %R on a 5-minute chart will whipsaw frequently compared to the same setting on daily data.

Strengths and Limitations of Williams %R
Strengths:
Simple calculation with clear overbought and oversold levels
Quick responsiveness due to lack of smoothing
Universal availability on platforms like TradingView, Thinkorswim, MetaTrader
Bounded range makes cross-market comparison straightforward
Limitations:
Produces false signals in strong directional trends
Whipsaws in highly volatile, choppy conditions
No built-in trend direction filtering
Lagging nature (derived from past prices)
Comparison with similar momentum oscillators:
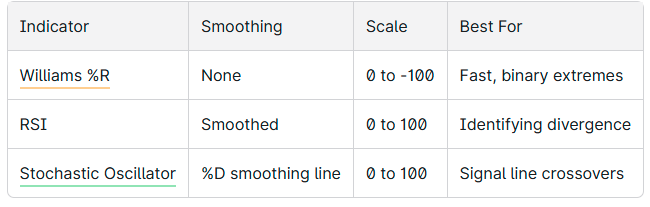
The williams r works better for traders wanting raw, unfiltered momentum readings. RSI and Stochastic suit those preferring smoothed signals.
Combining Williams %R with Other Technical Tools
Using Williams %R alongside other technical indicators and price structure significantly improves reliability through confluence.
Moving average filter: Only act on oversold buy signals when price trades above a rising 200-period moving average. Only take overbought sell signals when price is below a falling 200-period MA.
Volume confirmation: Volume spikes at extremes suggest conviction. A Williams %R oversold reading combined with above-average volume at support carries more weight than the same reading with declining volume.
Support/Resistance validation: Horizontal zones, supply-demand areas, and chart patterns provide context for whether an overbought or oversold reading is actionable. An oversold signal at a major support level in an interactive charting environment offers higher probability than the same signal in open space.
Ideal confluence setup:
Williams %R below -80 (oversold)
Price at established support zone
Rising 200-day moving average
Volume spike or hammer candlestick pattern
Higher timeframe trend bullish
Practical Tips, Best Practices, and Common Mistakes
Common beginner mistakes:
Trading every overbought or oversold reading without context
Ignoring the larger trend direction
Over-optimizing look-back periods on limited data
Neglecting stop-loss placement and risk management
Using Williams %R in isolation without confirmation
Best practices:
Define entry and exit rules before placing trades
Always check a higher timeframe for trend context
Keep position sizes modest when trading counter-trend
Log all trades in a journal with screenshots
Backtest across multiple market regimes (bull, bear, sideways)
Testing requirements: Use at least 2-3 years of historical data covering distinct market conditions. The 2018-2024 period provides COVID volatility, post-2022 rate hike environments, and various ranging phases for comprehensive testing.
Five actionable tips:
Start with the 14-period default before experimenting
Add the -50 midline to your chart for trend bias
Combine with a 200-period moving average filter
Require price confirmation before acting on extremes
Journal your trading style adjustments and results
Conclusion and Key Takeaways
Williams %R remains a valuable tool for traders seeking a fast, unsmoothed momentum indicator to identify potential reversal points. Its bounded 0 to -100 range, clear overbought and oversold thresholds at -20 and -80, and the practical -50 midline provide consistent interpretation across all markets.
The three primary strategy applications—range trading, trend pullbacks, and divergence setups—each require confirmation from price action and other technical analysis tools. No oscillator should be used in isolation, and Williams %R is no exception. False signals in trending markets and whipsaws in volatile conditions demand proper risk controls.
Start by applying the default 14-period setting to your preferred currency pairs, stocks, or indices. Observe how the indicator behaves during different market conditions. Test the strategies outlined here on historical data, refine your parameters based on results, and integrate Williams %R thoughtfully into a rule-based trading plan that includes clear exit points and position sizing.